

Gold price gains traction, Israel strikes Rafah boosts safe-haven flows

- Gold Price Forecast: Gold Poised to Break $4,200 as Oil Price Slump Eases Inflation Fears
- Gold declines despite easing concerns over inflation, interest rate hikes
- Fed Decision Eve: 104 Economists Expect No Change; Why Is Citadel Securities Betting on a Surprise Hike?
- Gold Price Forecast: Can Gold Hold $4,020 as Fed Rate Hike Expectations Rise?
- Middle East War updates: US-Iran pause strikes as Trump weighs up diplomatic options
- WTI Oil flirts with the $80 level amid speculation about US-Iran peace talks
■Gold price gains ground in Monday’s Asian session.
■The uptick in yellow metal is supported by the weaker USD and rising Middle East geopolitical risks.
■The speeches from the Fed's Bowman, Mester and Kashkari on Tuesday will be closely watched.
Gold price (XAU/USD) gathers strength on Monday. The softer US Dollar (USD) and the renewed escalating geopolitical tensions in the Middle East provide some support to the yellow metal. In the longer term, the precious metal might be bolstered by the growing central banks' demand for gold. Nonetheless, the lower bets on the Federal Reserve (Fed) rate cut this year and the hawkish stance from Fed officials might exert some selling pressure on XAU/USD as it makes gold less attractive as a store of value when interest rates rise.
On Monday, the US banks will be closed due to the Memorial Day bank holiday. Gold traders will take more cues from the Fed’s speech on Tuesday, including Michelle Bowman, Loretta Mester and Neel Kashkari. The first reading of US Gross Domestic Product (GDP) for the first quarter on Thursday will be in the spotlight, which is estimated to expand 1.5% in Q1. The stronger-than-expected data might boost the Greenback and weigh on USD-denominated gold.
Daily digest market movers: Gold price attracts some buyers amid the geopolitical risks
The Ministry of Health in Gaza said that at least 35 Palestinians were killed and dozens more were injured as a result of Israeli air attacks on a camp in Rafah for displaced people on Sunday, per CNN.
Gold price has increased by over 16% year-to-date, hitting a record high of over $2,400 per ounce in May, according to World Gold Council data.
The US Durable Goods Orders rose by 0.7% MoM in April from the downward revision of 0.8% in March, better than the expectation of -0.8%.
The University of Michigan Consumer Sentiment Index came in at 69.1 in May from 67.4 in April, above the market consensus of 67.5. Inflation expectations for one year rose slightly to 3.3% from 3.2%, while five-year inflation expectations eased to 3% from 3.1%.
UBS analysts recently raised their gold price forecast to $2,600 for the end of 2024. Citi analysts predicted gold would hit $3,000 per ounce in the next six to 18 months.
Gold imports to India, the world's second-largest gold consumer, might fall nearly a fifth this year as high prices encourage retail customers to exchange old jewellery for new items, per Reuters.
Technical analysis: Gold price keeps the bullish vibe unchanged on the daily timeframe
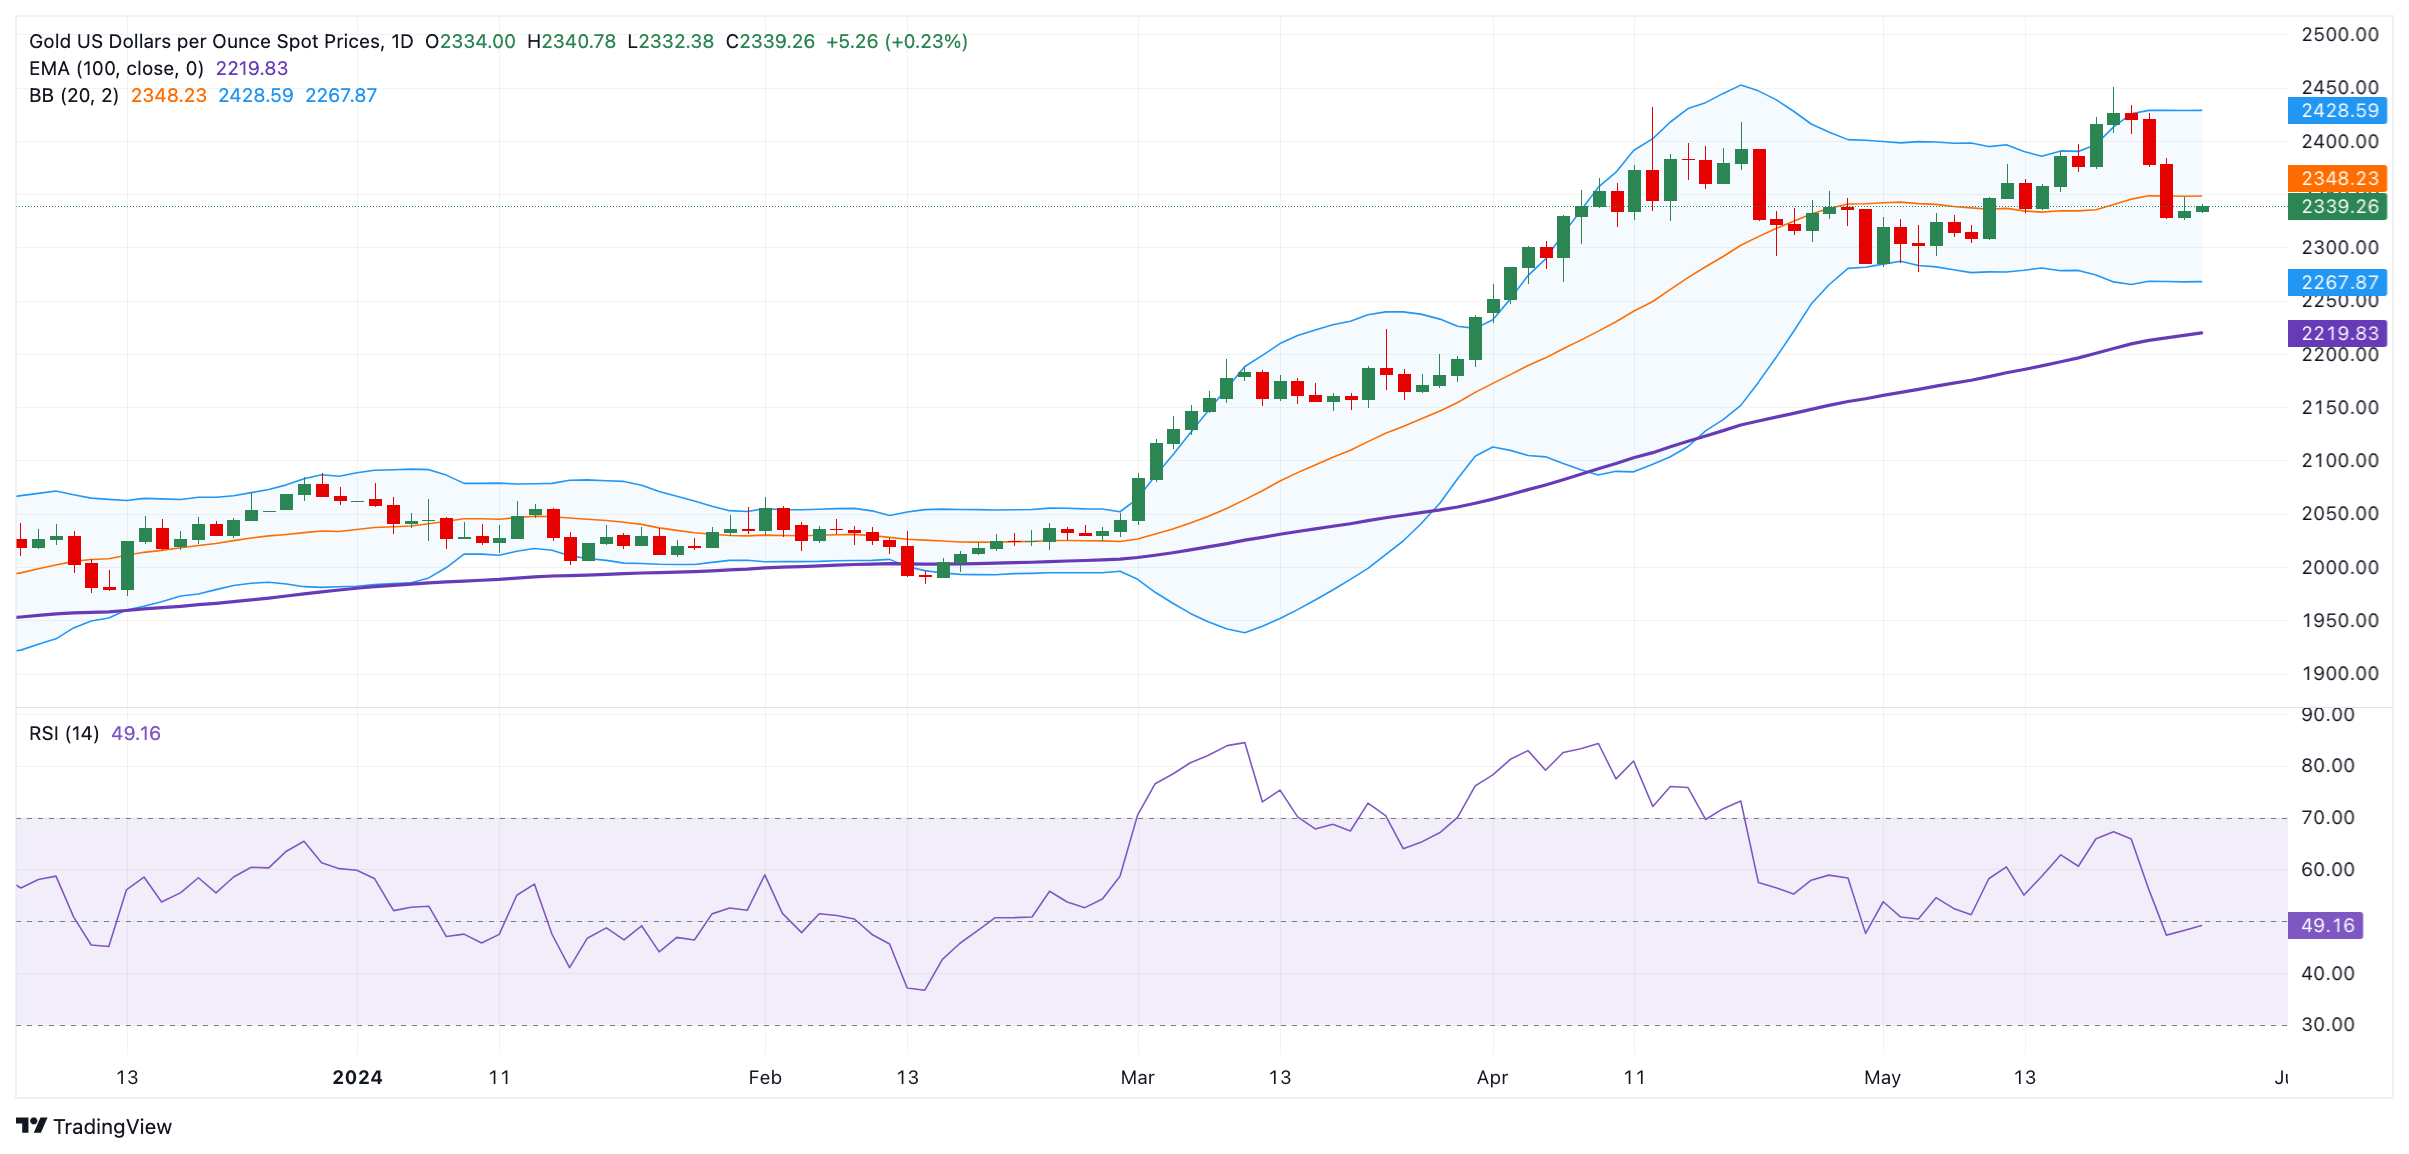
The gold price edges higher on the day. The constructive stance of the precious metal remains unchanged as it holds above the key 100-day Exponential Moving Average (EMA) on the daily chart. However, the 14-day Relative Strength Index (RSI) stands in a bearish zone around 48.5, indicating that consolidation or further downside in gold prices cannot be ruled out.
The first upside barrier for yellow metal will emerge near the upper boundary of the Bollinger Band at $2,428. Extended gains will see a rally to the all-time high of $2,450 and the $2,500 psychological mark.
On the downside, the $2,300 round level acts as an initial support level for the precious metal. A break below this level will see a drop to the lower limit of the Bollinger Band at $2,267. The next potential contention level is seen at the 100-day EMA of $2,220.
US Dollar price today
The table below shows the percentage change of US Dollar (USD) against listed major currencies today. US Dollar was the strongest against the Swiss Franc.
| USD | EUR | GBP | CAD | AUD | JPY | NZD | CHF | |
| USD | -0.03% | -0.05% | -0.02% | -0.14% | -0.08% | -0.10% | 0.00% | |
| EUR | 0.03% | -0.02% | 0.00% | -0.11% | -0.04% | -0.07% | 0.03% | |
| GBP | 0.05% | 0.01% | 0.02% | -0.09% | -0.03% | -0.05% | 0.04% | |
| CAD | 0.03% | 0.00% | -0.02% | -0.12% | -0.04% | -0.07% | 0.01% | |
| AUD | 0.16% | 0.14% | 0.12% | 0.14% | 0.09% | 0.04% | 0.16% | |
| JPY | 0.08% | 0.04% | 0.04% | 0.03% | -0.08% | -0.02% | 0.06% | |
| NZD | 0.10% | 0.06% | 0.04% | 0.07% | -0.07% | 0.03% | 0.09% | |
| CHF | 0.00% | -0.03% | -0.04% | -0.02% | -0.14% | -0.07% | -0.10% |
The heat map shows percentage changes of major currencies against each other. The base currency is picked from the left column, while the quote currency is picked from the top row. For example, if you pick the Euro from the left column and move along the horizontal line to the Japanese Yen, the percentage change displayed in the box will represent EUR (base)/JPY (quote).
Read more
* The content presented above, whether from a third party or not, is considered as general advice only. This article should not be construed as containing investment advice, investment recommendations, an offer of or solicitation for any transactions in financial instruments.


