


- Gold Price Forecast: Gold Poised to Break $4,200 as Oil Price Slump Eases Inflation Fears
- Gold declines despite easing concerns over inflation, interest rate hikes
- Fed Decision Eve: 104 Economists Expect No Change; Why Is Citadel Securities Betting on a Surprise Hike?
- Gold Price Forecast: Can Gold Hold $4,020 as Fed Rate Hike Expectations Rise?
- Middle East War updates: US-Iran pause strikes as Trump weighs up diplomatic options
- WTI Oil flirts with the $80 level amid speculation about US-Iran peace talks

■Gold price trades with a negative bias on Thursday.
■The hawkish stance of the FOMC minutes from last month's meeting might cap the precious metal’s upside.
■Investors will focus on the first reading of US PMI data for May, due on Thursday.
Gold price (XAU/USD) extends the decline on Wednesday. The further upside of the yellow metal might be limited, as the FOMC minutes were interpreted as significantly more hawkish than previous releases. The cautious approach of the US Fed to hold its restrictive policy for longer boosts the Greenback broadly and exerts some selling pressure on the gold price.
Gold traders will closely watch the preliminary reading of the US Manufacturing and Services Purchasing Managers Index (PMI) for May. A weaker reading might trigger hope for Fed rate cuts and support gold. Additionally, geopolitical tensions, uncertainties, and sticky inflation could support the precious metal and cap the downside in the near term. Apart from this, the Chicago Fed National Activity Index, weekly Initial Jobless Claims, New Home Sales, and Fed’s Bostic will be in focus.
Daily Digest Market Movers: Gold price remains sensitive to the Fed’s hawkish remarks
The minutes from the recent policy meeting of the FOMC released Wednesday indicated that “participants observed that while inflation had eased over the past year, in recent months there had been a lack of further progress toward the Committee’s 2 percent objective.”
The minutes further stated that “participants assessed that maintaining the current target range for the federal funds rate at this meeting was supported by data indicating continued solid economic growth.”
Investors have priced in nearly a 60% chance of the first cut to happen in September and two reductions of a quarter percentage point before the end of the year, according to the CME FedWatch Tool.
The preliminary of US S&P Global Manufacturing and Service PMI is expected to remain unchanged at 50.0 and 51.3 in May, respectively.
The People's Bank of China (PBoC) has been the largest buyer among its worldwide counterparts over the past year. Its addition of 225 tonnes to its gold reserves last year was the highest on record since at least 1977.
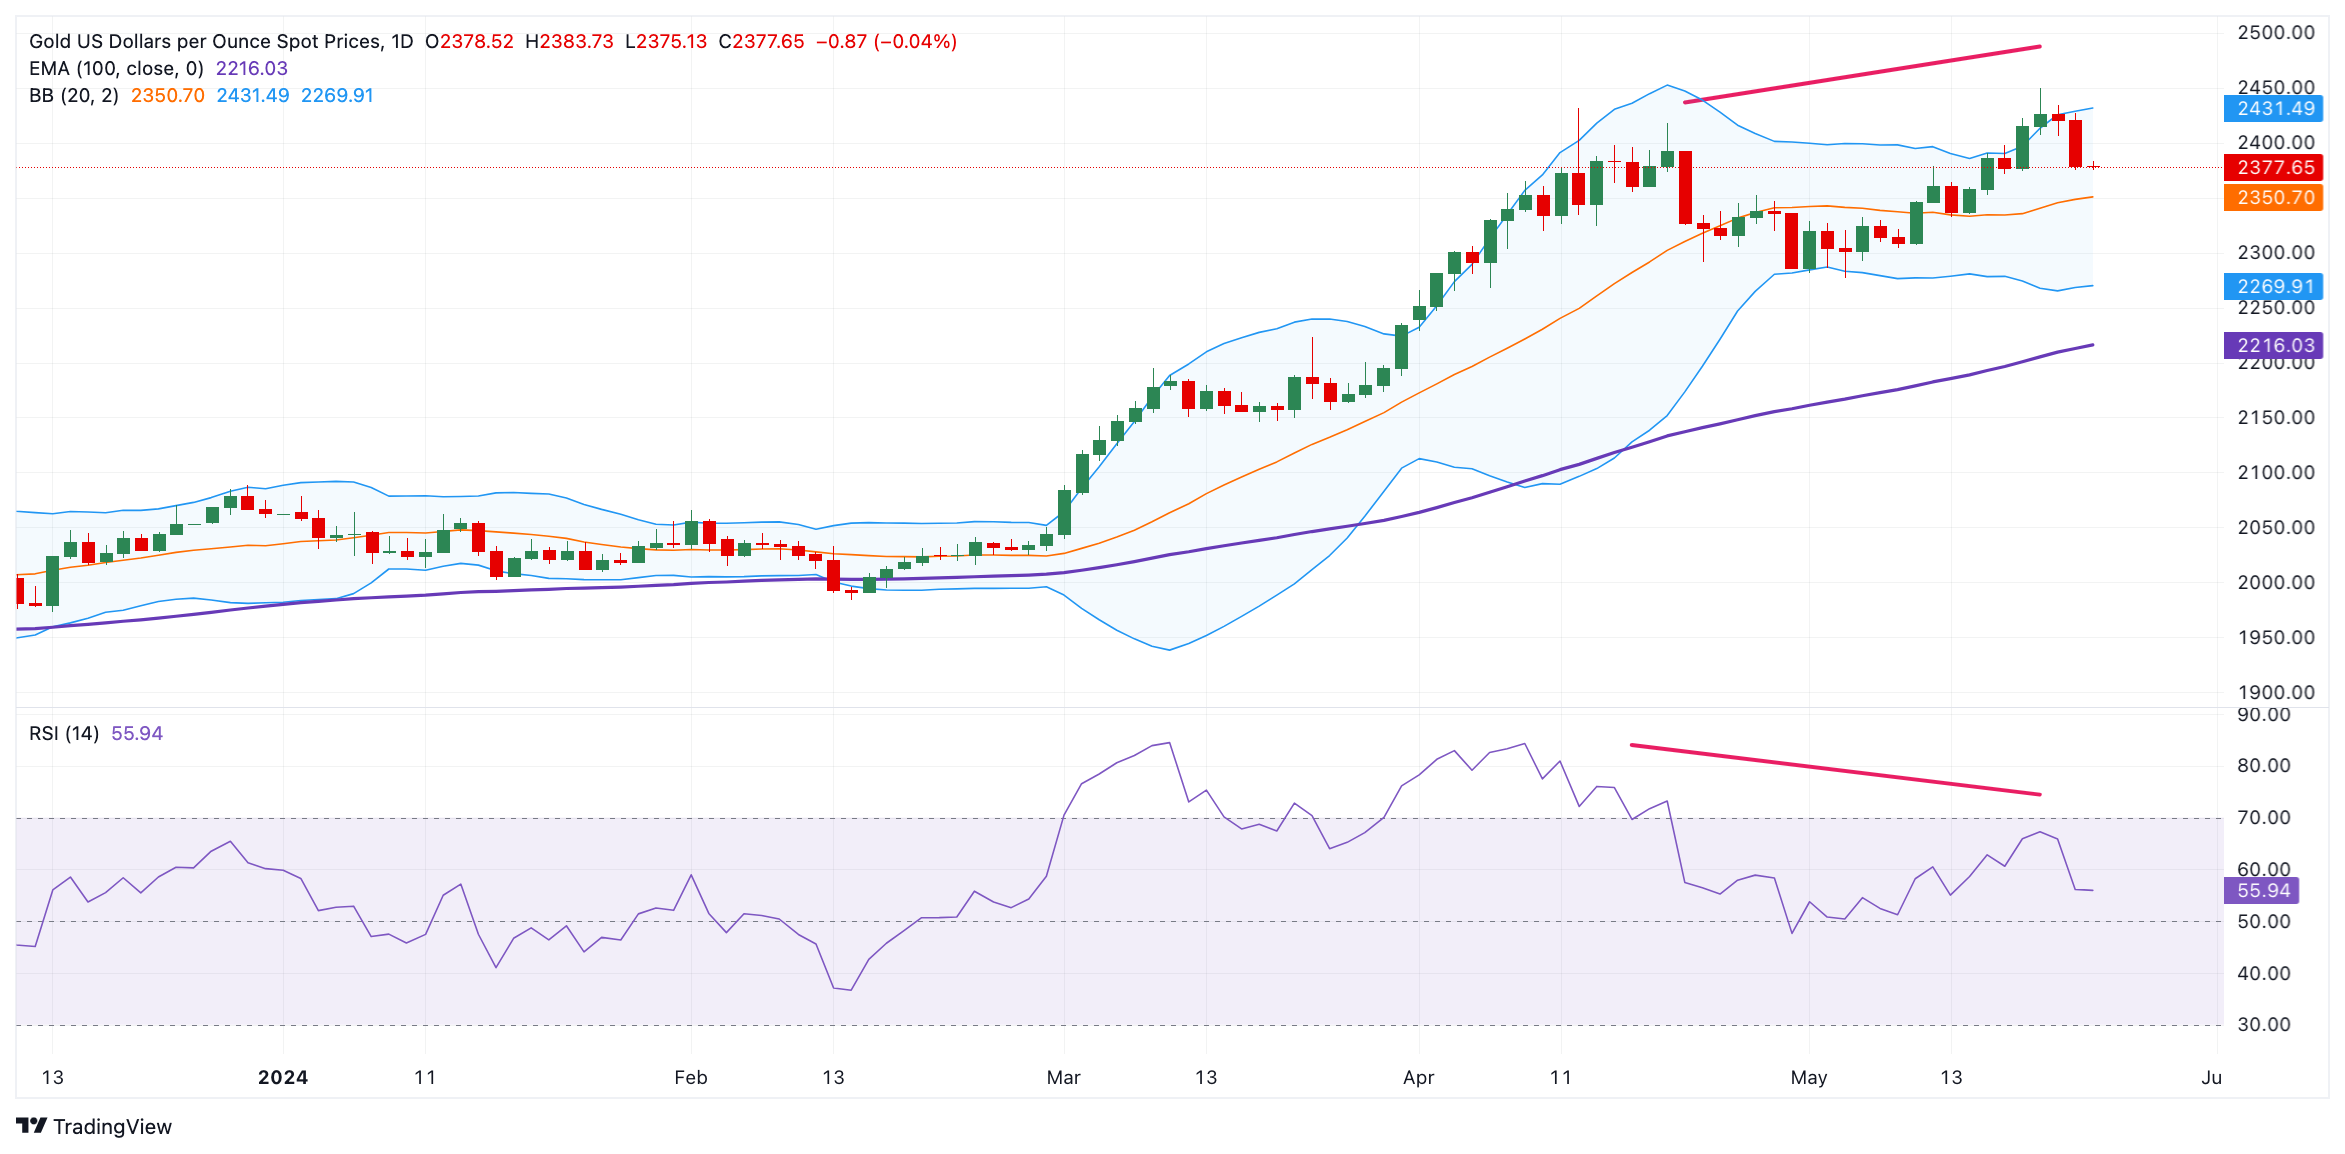
Technical Analysis: Gold price keeps the bullish vibe on the daily chart, eyes are on a Bearish Divergence
Gold price trades softer on the day. The constructive view of the yellow metal remains intact as it is above the key 100-period Exponential Moving Average (EMA) on the daily timeframe. The 14-day Relative Strength Index (RSI) holds above the bullish zone near 56.10, supporting the buyers for the time being. Nonetheless, XAU/USD has formed a bearish divergence as the price has moved to an all-time high on May 20, but the RSI indicator has formed lower highs, suggesting the momentum is slowing and there will likely be a correction or consolidation in price in the near term.
The key resistance level for the precious metal will emerge near the the upper boundary of Bollinger Band and an all-time high of $2,450. A break above this level will expose the $2,500 psychological round mark.
On the downside, a low of May 13 at $2,332 acts as an initial support level for gold. The additional downside filter to watch is the lower limit of the Bollinger Band at $2,270. A breach of the mentioned level will see a drop to the 100-period EMA of $2,216.
US Dollar price today
The table below shows the percentage change of US Dollar (USD) against listed major currencies today. US Dollar was the weakest against the .
|
USD |
EUR |
GBP |
CAD |
AUD |
JPY |
NZD |
CHF |
USD |
|
-0.02% |
-0.01% |
0.00% |
-0.02% |
0.09% |
-0.12% |
0.00% |
EUR |
0.02% |
|
0.00% |
0.03% |
-0.01% |
0.12% |
-0.10% |
0.01% |
GBP |
0.01% |
0.00% |
|
0.03% |
-0.01% |
0.12% |
-0.10% |
0.01% |
CAD |
-0.01% |
-0.03% |
-0.03% |
|
-0.05% |
0.09% |
-0.13% |
-0.02% |
AUD |
0.04% |
0.01% |
0.02% |
0.03% |
|
0.12% |
-0.09% |
0.02% |
JPY |
-0.08% |
-0.10% |
-0.12% |
-0.07% |
-0.16% |
|
-0.22% |
-0.10% |
NZD |
0.12% |
0.10% |
0.11% |
0.13% |
0.09% |
0.20% |
|
0.12% |
CHF |
0.02% |
-0.01% |
-0.01% |
0.03% |
-0.02% |
0.11% |
-0.11% |
|
The heat map shows percentage changes of major currencies against each other. The base currency is picked from the left column, while the quote currency is picked from the top row. For example, if you pick the Euro from the left column and move along the horizontal line to the Japanese Yen, the percentage change displayed in the box will represent EUR (base)/JPY (quote).
Read more
* The content presented above, whether from a third party or not, is considered as general advice only. This article should not be construed as containing investment advice, investment recommendations, an offer of or solicitation for any transactions in financial instruments.


