


Gold price holds strength as Middle East tensions propel safe-haven demand


Gold price trades close to $2,400 amid worsening geopolitical tensions.
The US Dollar’s upside stalls as investors see other central banks postponing rate cut plans.
US bond yields are down despite the Fed maintaining a hawkish stance.
Gold price (XAU/USD) faces pressure to recapture new all-time highs around $2,430 in Friday’s European session. The precious metal still holds some intraday gains, supported by safe-haven flows after worsening Middle East tensions. On Friday, Israel launched a retaliatory attack against Iran targeting the area around the city of Isfahan, Reuters reports. Iran has largely downplayed the attack by saying that their air defence has destroyed three drones. Signs of no further retaliation from Iran and what appears to be a limited airstrike have eased initial fears in markets, prompting Gold to pare gains.
The hawkish interest-rate outlook from Federal Reserve (Fed) policymakers also keeps Gold’s upside limited. Fed policymakers maintain the argument that borrowing costs need to remain higher for a longer period as progress in inflation declining to the 2% target has slowed significantly. Still, this recent hawkish Fed commentary hasn’t translated into a pickup in US Treasury bond yields, with 10-year US Treasury yields falling to 4.58% in Friday’s London session.
The US Dollar Index (DXY), which tracks the US Dollar’s value against six major currencies, edges down to 106.10 as traders reassess expectations for rate cuts from other central banks like the Bank of England (BoE) and the Reserve Bank of New Zealand (RBNZ). While initially it seemed that many central banks would cut rates before the Fed, investors are increasingly pricing in delays as well in other countries amid fears that price pressure could increase again.
Daily digest market movers: Gold price whipsaws after Israel’s attack against Iran
Gold price surrenders the majority of intraday gains posted after the Israeli military responded to Iran’s attack, Reuters reports. A New York Times report quoted Iranian officials saying that the strike had hit a military air base near the city of Isfahan. However, the Israeli state has not confirmed the drone attack.
The confirmation of the airstrike by Israel would deepen fears of Iran retaliating again, which would widen the war scope beyond Gaza. Investing in Gold becomes more appealing when geopolitical tensions escalate.
Meanwhile, deepening uncertainty about when the Federal Reserve (Fed) will start reducing interest rates keeps limiting the upside in Gold. The CME FedWatch tool shows traders are pricing in the September meeting as the moment when the central bank could pivot to rate cuts. However, Fed policymakers refrain from providing a concrete time frame as inflation remains stubborn due to robust consumer spending and tight labor market conditions.
On Thursday, Atlanta Fed President Raphael Bostic said the progress in inflation declining towards the 2% target will be slower than expected and conditions for rate cuts won’t be favorable for the central bank towards the end of the year. Bostic added he is comfortable being patient and not “in a mad dash hurry” for rate cuts because labor demand is robust and wage growth remains resilient.
Separately, New York Fed President John Williams also delivered a hawkish interest rate guidance. Williams said he doesn't see the urgency for rate cuts and warned that the central bank is ready to hike again if the data suggests price pressures accelerate.
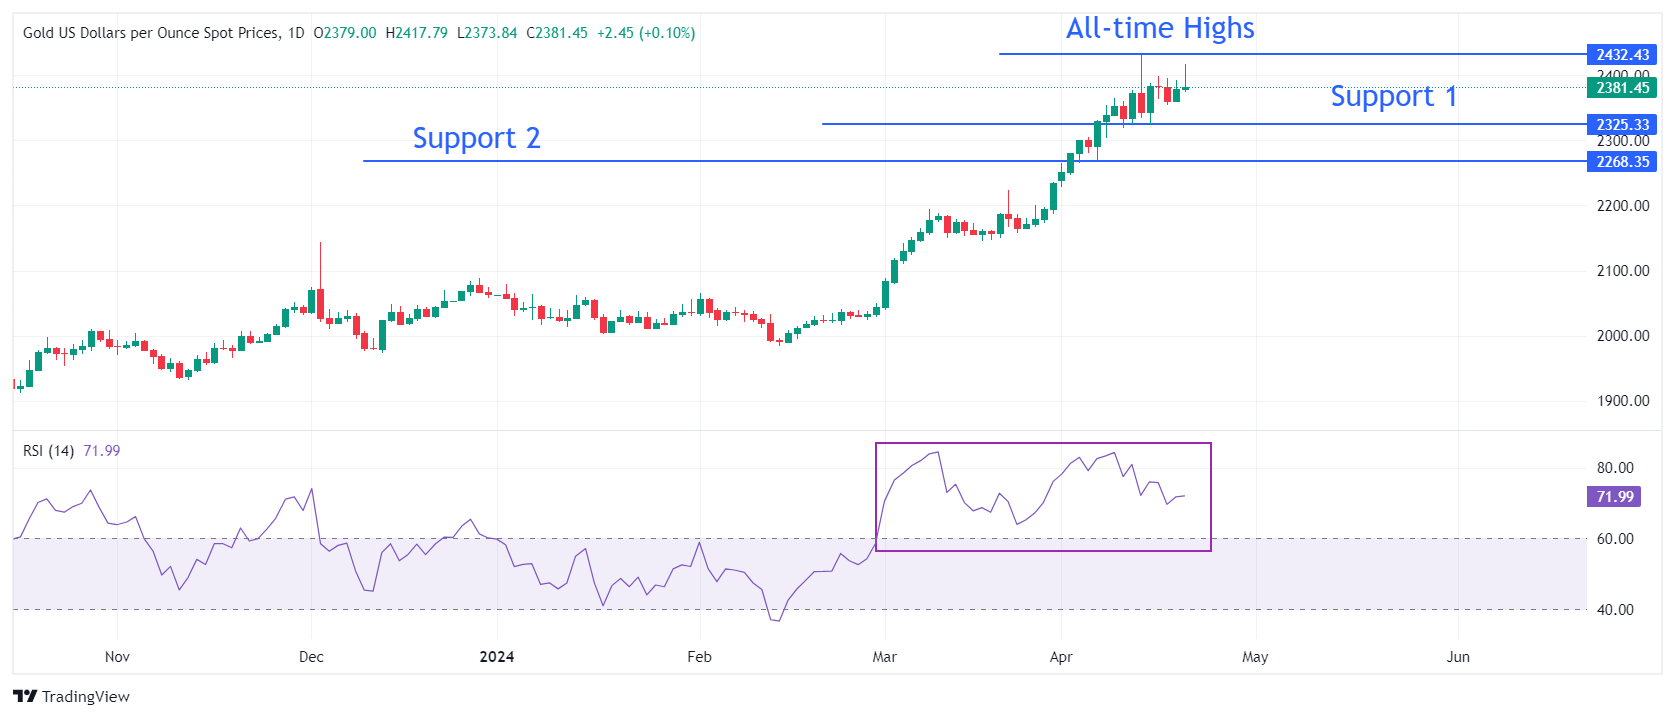
Technical Analysis: Gold price faces pressure above $2,400
Gold price drops while attempting to sustain above the crucial resistance of $2,400. The precious metal remains in a restricted trajectory as the Fed’s hawkish guidance restricts the upside. Meanwhile, geopolitical uncertainty continues to provide buying interest.
The Gold remains sideways as momentum oscillators cool down after turning extremely overbought. The 14-period Relative Strength Index (RSI) on the daily chart drops slightly after peaking around 85.00. The broader-term demand is intact as the RSI remains in the bullish range of 60.00-80.00.
On the downside, April 5 low near $2,268 and March 21 high at $2,223 will be major support areas.
Read more
* The content presented above, whether from a third party or not, is considered as general advice only. This article should not be construed as containing investment advice, investment recommendations, an offer of or solicitation for any transactions in financial instruments.


