

Silver Price Analysis: XAG/USD remains depressed near $29.30-35 area, lacks follow-through

- $1.5 Billion in Crypto Assets Liquidated, Bitcoin Falls Below $66,000 Mark. What Is the Reason?
- Bitcoin Suffers Year’s Strongest Waterfall-Style Decline. Will It Next Drop to the $60,000 Mark?
- WTI rises to near $93.00 as Iran launches missiles toward Kuwait, Bahrain
- Bitcoin drops below $65K amid reinforced bear market signals
- Forex Today: US Dollar stays resilient ahead of key US data
- Silver Price Forecast: Trump Signals Rapid Progress in US-Iran Negotiations, Bulls Target $90
■ Silver drifts lower during the Asian session on Tuesday and snaps a three-day winning streak.
■ The mixed technical setup warrants some caution before placing aggressive directional bets.
■ A sustained strength beyond the $30.00 mark is needed to negate any near-term negative bias.
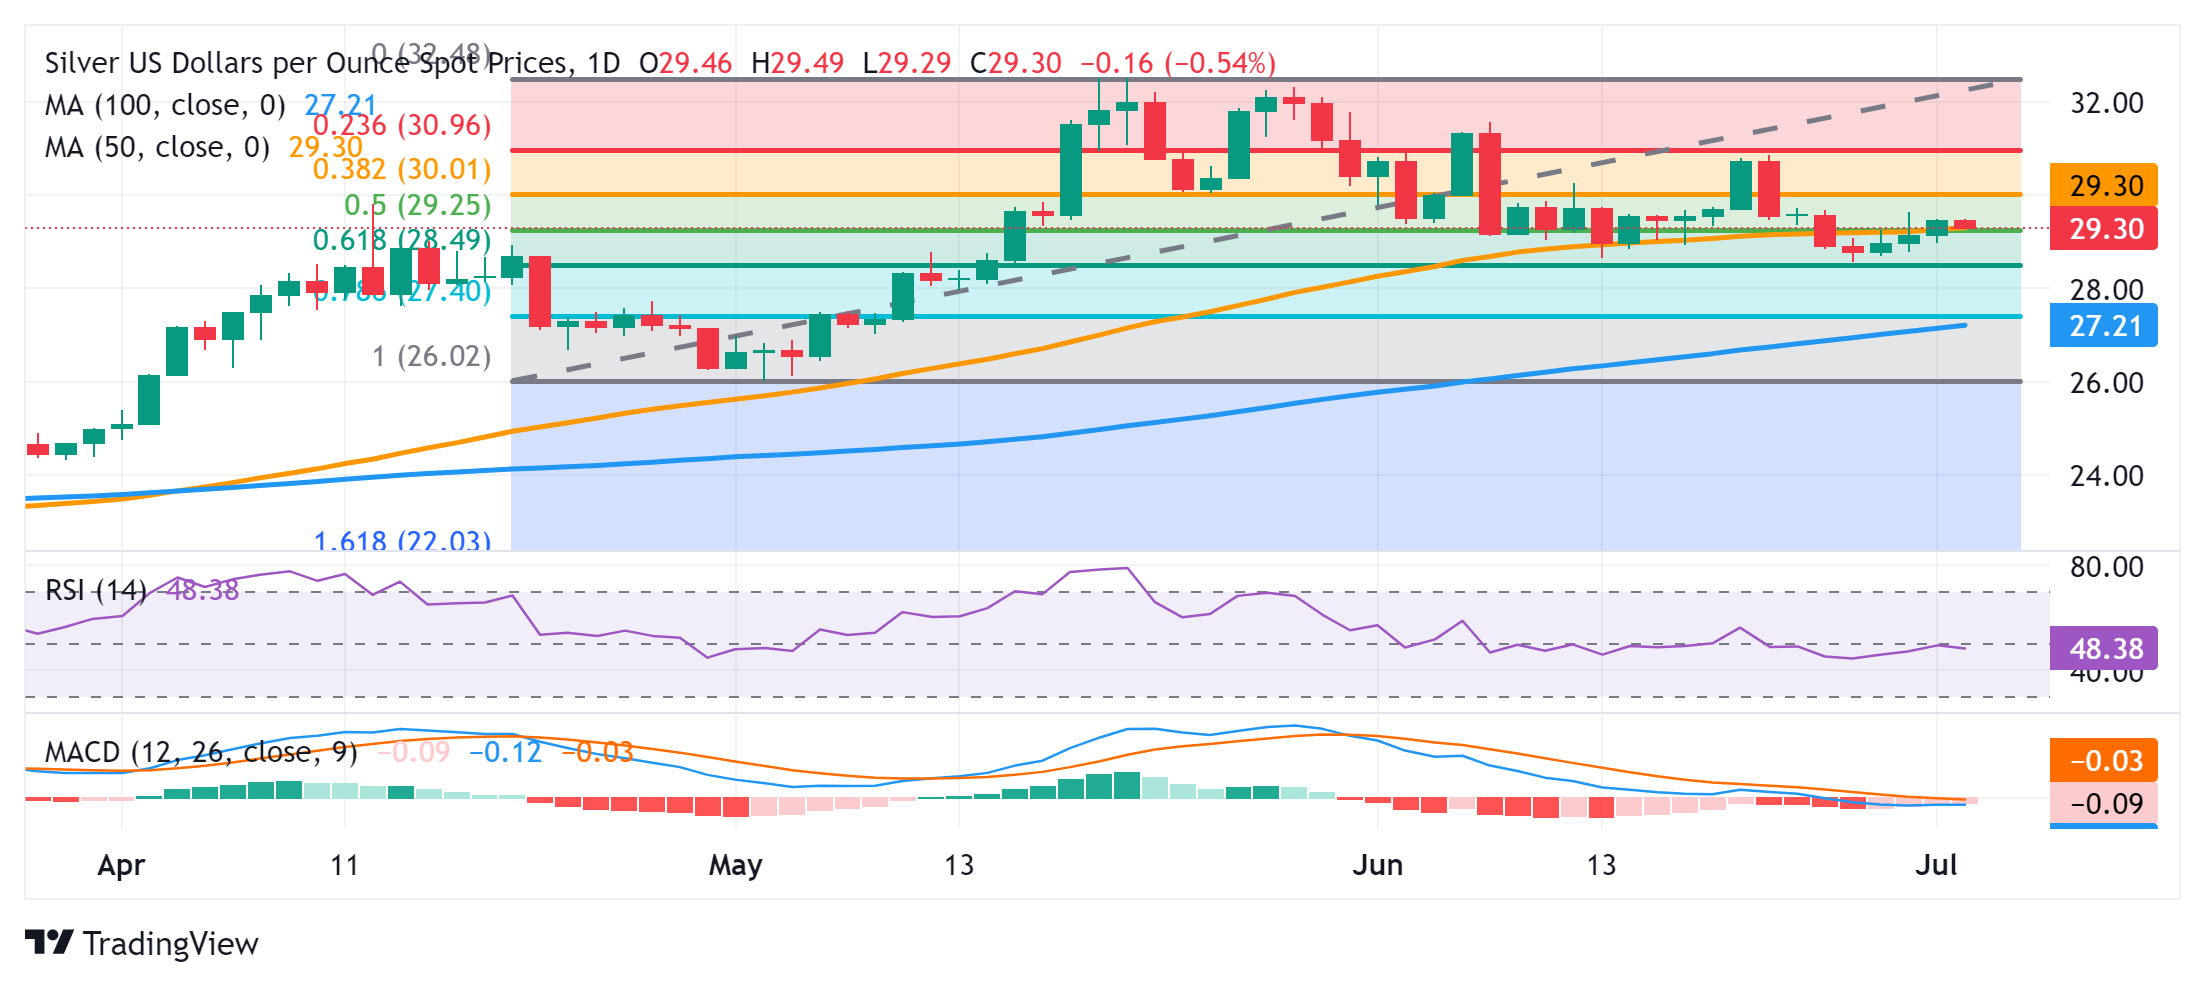
Silver (XAG/USD) struggles to capitalize on its modest gains registered over the past three days and attracts some sellers during the Asian session on Tuesday. The white metal currently trades around the $29.35-$29.30 area, down 0.45% for the day, and for now, seems to have stalled the recent recovery from its lowest level since mid-May touched last Wednesday.
From a technical perspective, last week's breakdown through the 50-day Simple Moving Average (SMA) was seen as a fresh trigger for bearish traders. That said, the subsequent bounce from the 61.8% Fibonacci retracement level of the $26.02-$32.51 rally and neutral oscillators on the daily chart warrant some caution before positioning for further losses.
In the meantime, the $29.55-$29.60 area is likely to act as an immediate hurdle ahead of the 38.2% Fibo. level, around the $30.00 psychological mark. A sustained strength beyond the latter will negate any near-term negative bias and lift the XAG/USD to the $31.00 neighborhood with some intermediate resistance near the $30.30-$30.35 supply zone.
On the flip side, the $29.00 round figure is likely to protect the immediate downside ahead of the $28.60-$28.55 region, or the 61.8% Fibo. level. A convincing break below has the potential to drag the XAG/USD towards the $28.00 mark. The downfall could extend further towards the $27.40-$27.30 confluence – comprising 78.6% Fibo. and the 100-day SMA.
Silver daily chart
* The content presented above, whether from a third party or not, is considered as general advice only. This article should not be construed as containing investment advice, investment recommendations, an offer of or solicitation for any transactions in financial instruments.


