

Silver Price Analysis: XAG/USD wavers, clings to gains above $28.00

- Gold Price Forecast: Oil Price Breaking $100 Fuels Inflation Concerns, Will Gold Prices Fall Further?
- Gold Price Trend Forecast: Expectations of Easing US-Iran Tensions Boost Gold Prices, $4,070 Becomes Key Level for Bulls and Bears
- Gold rallies to over two-week high, eyes $4,150 as traders track US-Iran diplomacy efforts
- Euro declines to near 1.1400 as US launches fresh strikes on Iran
- Tesla Q2 Earnings Preview: Record Deliveries Fail to Hide Profit Pressure, Can Musk Rely on AI and Autonomous Driving to Unlock New Growth Space?
- WTI climbs above $87.00 as Middle East conflict threatens key choke points

■ Silver edges higher, showing resilience with a 0.50% gain, yet faces tough resistance near $28.74.
■ Technical analysis suggests potential pullback risks with $28.00 as a pivotal level; further support at $27.59 and $27.00.
■ Upside momentum could resume if prices surpass $28.28, targeting higher resistance points at $28.74 and potentially $29.00.
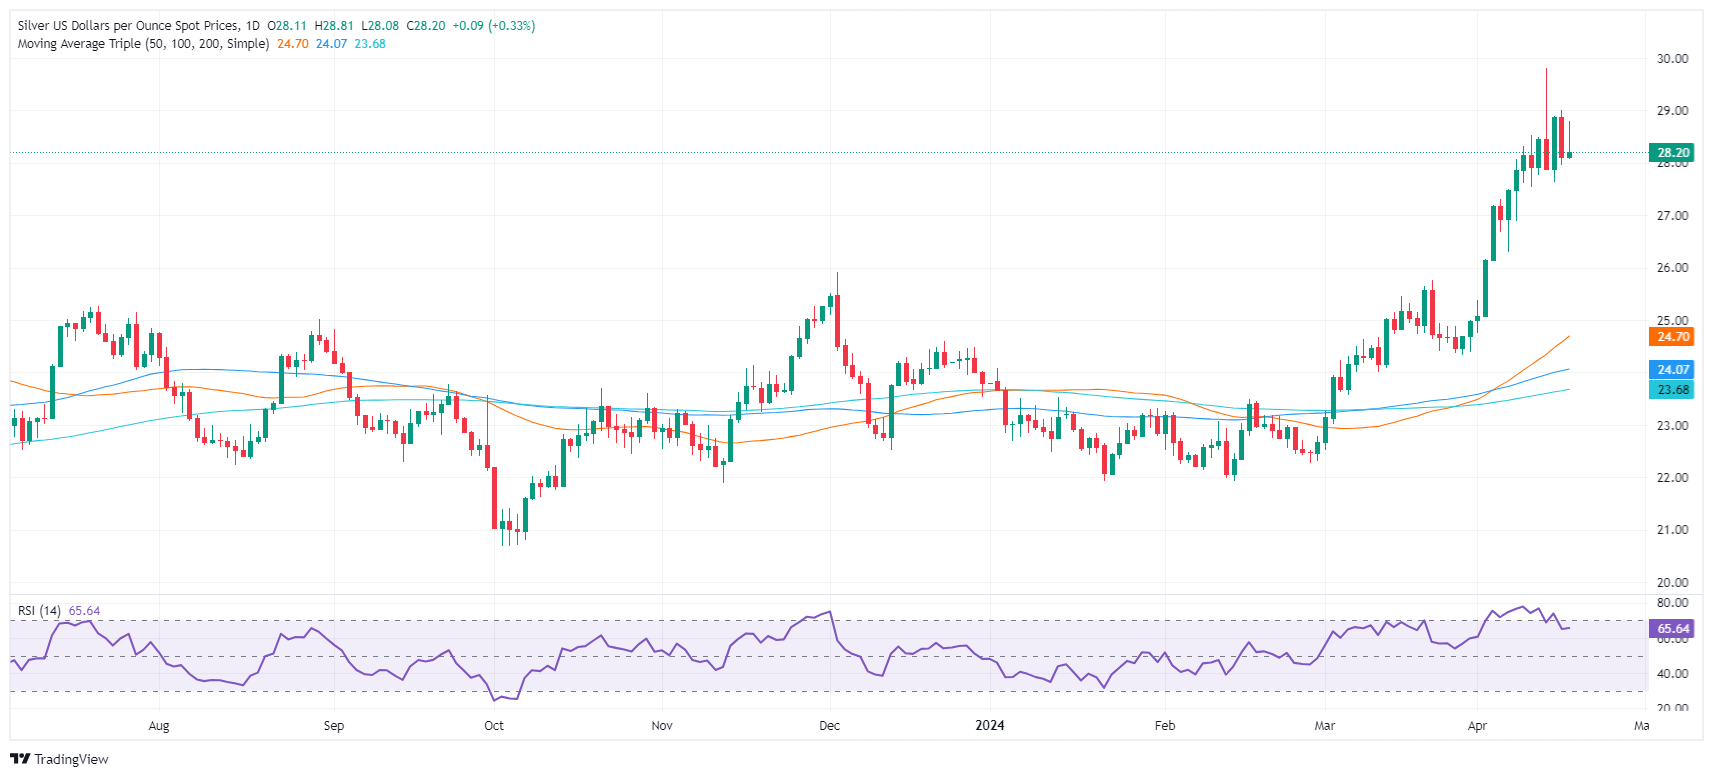
Silver’s prices remain in positive territory but continued to register higher tails in the daily chart, signaling buyers' failure to commit to higher prices above the May 18, 2021, high of $28.74. At the time of writing, XAG/USD trades at $28.21 and gains 0.50%.
XAG/USD Price Analysis: Technical outlook
The daily chart depicts the grey metal as upward biased even though it’s retreating below the crucial resistance level, exposing the significant $28.00 figure. Once that level is cleared, it could potentially lead to a significant shift in the market dynamics. Silver’s next support would be the April 15 low of $27.59 ahead of $27.00. Once that level is taken out, the next demand zone would be the December 4, 2023, high turned support at $25.91.
On the other hand, if buyers lift XAG/USD prices back above June 10, 2021, high at $28.28, it could clear the path to test $28.74. A breach of the latter will expose $29.00, followed by the year-to-date (YTD) high at $29.79.
XAG/USD Price Action – Daily Chart
Read more
* The content presented above, whether from a third party or not, is considered as general advice only. This article should not be construed as containing investment advice, investment recommendations, an offer of or solicitation for any transactions in financial instruments.


