
Silver Price Forecast: XAG/USD challenges strong resistance at nine-day EMA around $32.50


Silver price may find initial support at the six-week low of $31.65.
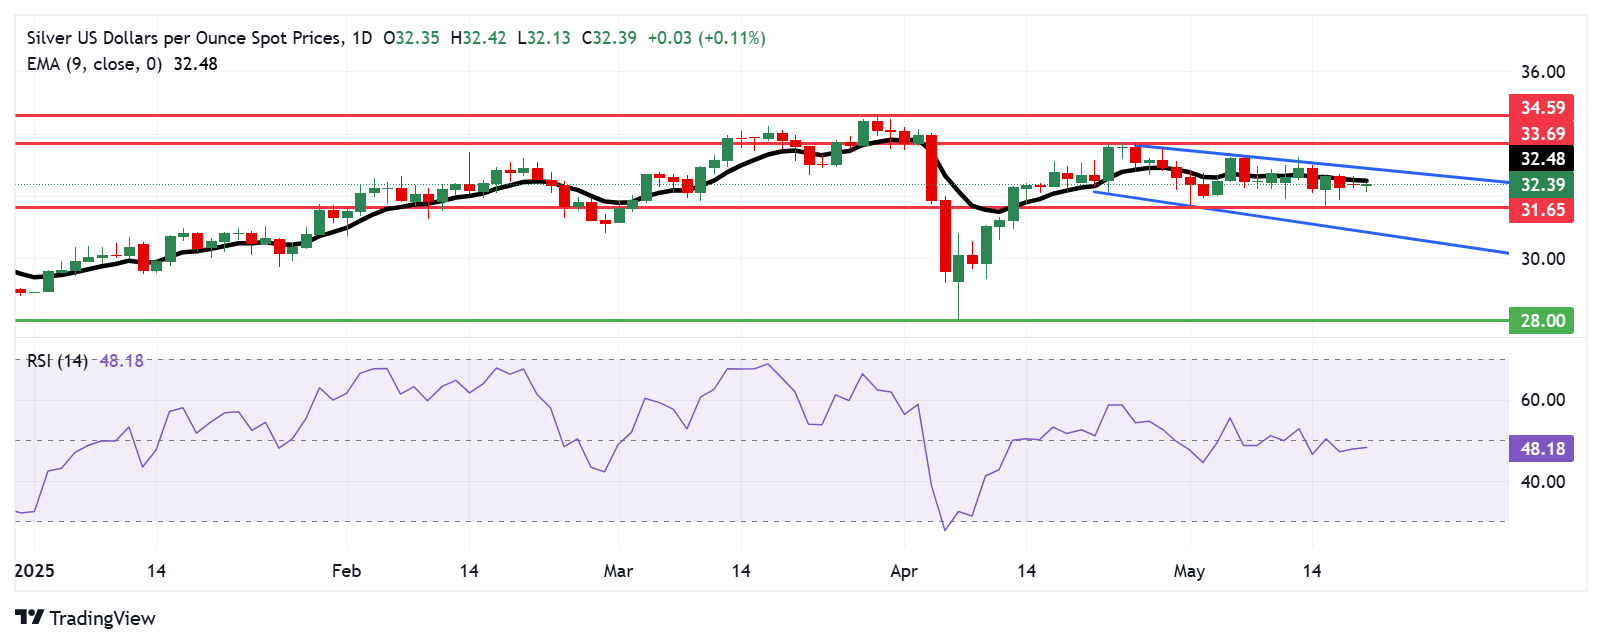
The 14-day RSI remains below the 50 level, indicating a potential for a bearish bias.
The nine-day EMA of $32.48 appears as the immediate resistance.
Silver price (XAG/USD) seems to extend its losses for the third successive session, trading around $32.30 per troy ounce during the European hours on Tuesday. Technical analysis of the daily chart indicates a developing bearish bias, as the precious metal price consolidates within a descending channel pattern.
The 14-day Relative Strength Index (RSI) remains below the 50 level, indicating a potential for a bearish bias. Additionally, the Silver price is positioned below both the nine-day Exponential Moving Average (EMA), further highlighting the short-term downturn momentum is in play.
On the downside, the Silver price could retest the six-week low at $31.65, which was recorded on May 15. A break below this level could put downward pressure on the metal price to test the lower boundary of the descending channel pattern around $30.90. A break below the channel could reinforce the bearish bias and open the doors for the price of the precious metal to navigate the region around the eight-month low of $28.00, marked on April 7.
The XAG/USD pair is testing its immediate barrier at the nine-day EMA of $32.48, followed by the descending channel’s upper boundary around the psychological level of $33.00. A break above this crucial resistance zone could weaken the bearish bias and support the pair to test the seven-week high at $33.69, reached on April 24, followed by the seven-month high of $34.59, last seen on March 28.
XAG/USD: Daily Chart
* The content presented above, whether from a third party or not, is considered as general advice only. This article should not be construed as containing investment advice, investment recommendations, an offer of or solicitation for any transactions in financial instruments.


