

Silver Price Forecast: XAG/USD trades with negative bias near $30.60; bullish potential intact

- Gold Price Forecast: Gold Poised to Break $4,200 as Oil Price Slump Eases Inflation Fears
- Gold Price Forecast: Oil Price Breaking $100 Fuels Inflation Concerns, Will Gold Prices Fall Further?
- Middle East War updates: US-Iran pause strikes as Trump weighs up diplomatic options
- WTI climbs above $87.00 as Middle East conflict threatens key choke points
- Today’s Market Recap: Oil Breaks $100, Fueling Inflation Fears, as AI Capex Faces Scrutiny and Tesla’s 14% Plunge Drags Down Tech Sector
- WTI Crude Breaks $90, Brent Crude Approaches $100, Middle East Shipping Risks Drive Continuous Rise in Oil Prices
Silver struggles to capitalize on the overnight move-up and ticks lower on Wednesday.
The setup favors bulls and supports prospects for the emergence of some dip-buying.
A convincing break and acceptance below $33.00 would negate the positive outlook.
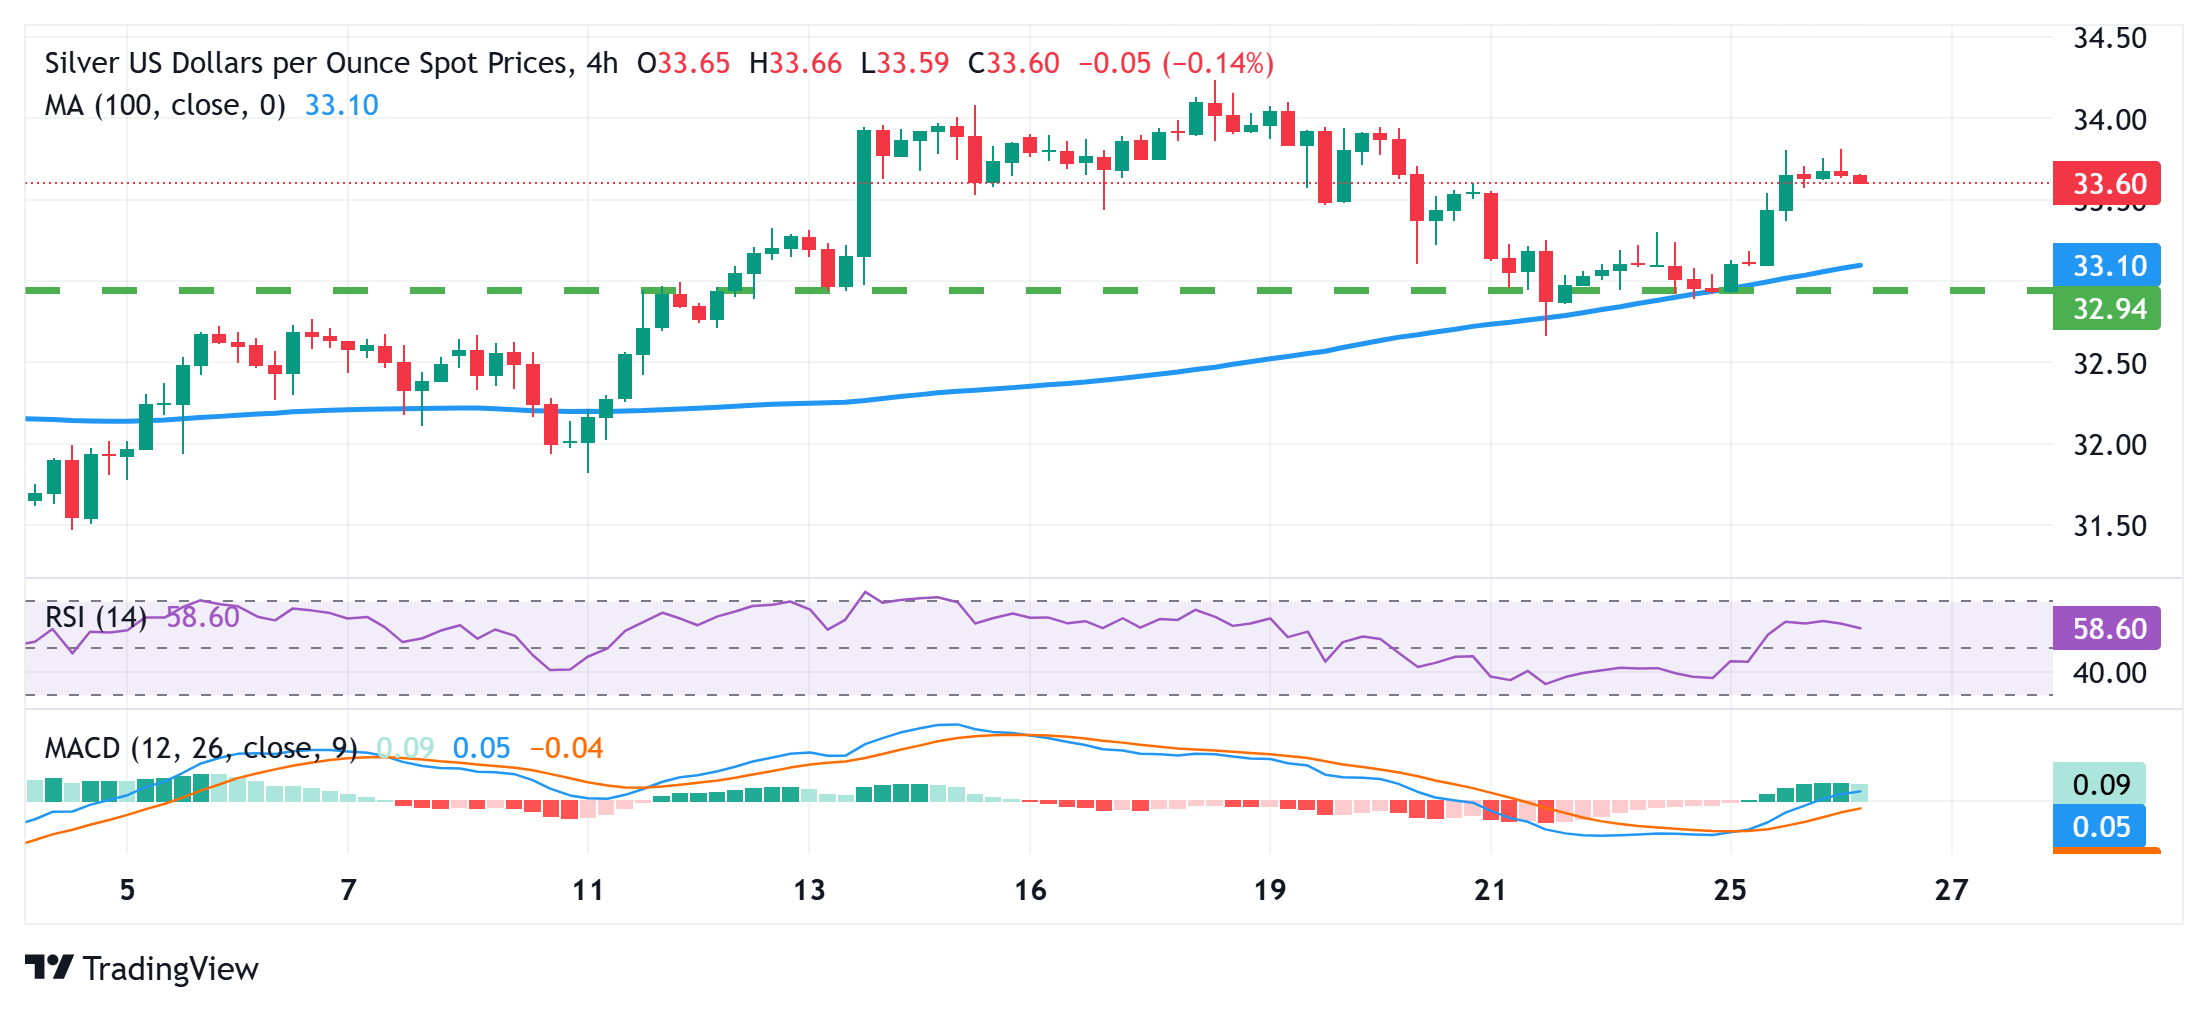
Silver (XAG/USD) attracts some sellers during the Asian session on Wednesday and erodes a part of the previous day's strong move up. The white metal currently trades around the $33.65-$33.60 area, down 0.30% for the day, though the downside seems limited on the back of a bullish technical setup.
The XAG/USD last week showed some resilience below the $33.00 mark and the 100-period Simple Moving Average (SMA) on the 4-hour chart. The subsequent move-up and positive oscillators on the daily chart validate the positive outlook. Hence, any further intraday slide could be seen as a buying opportunity and remain limited near the said handle.
A convincing break below, however, might prompt some technical selling and drag the XAG/USD further below last week's low, around the $32.65 region, towards testing the $32.00 round figure. This is followed by supports near the $31.80 zone (March 11 low), which if broken might shift the bias in favor of bears and expose the monthly low, around the $31.10 area.
On the flip side, bulls might now wait for a move beyond the $33.80 area, or the weekly high touched earlier this Wednesday, before placing fresh bets. The XAG/USD might then reclaim the $34.00 mark and climb further to a multi-month top, around the $34.20-$34.25 region touched on March 18, en route to a multi-year peak, around the $34.85 zone touched in October.
XAG/USD 4-hour chart
Read more
* The content presented above, whether from a third party or not, is considered as general advice only. This article should not be construed as containing investment advice, investment recommendations, an offer of or solicitation for any transactions in financial instruments.


