

Silver Price Forecast: XAG/USD rebounds from multi-day low, climbs back above $32.00

- Iranian military drones targeted US Fifth Fleet in Bahrain in response to southern US strikes
- Gold plummets below $4,200 as US‑Iran tensions spur hawkish rate bets ahead of US CPI
- Gold Price Trend Forecast: US-Iran Peace Talks Drive Gold Rebound, Is the Gold Slump Over?
- SpaceX Listing Imminent. Funds Flood Into SpaceX On-Chain Tokens, Bitcoin Rebound Momentum May Be Weakened
- US May CPI Preview: Rising Inflation May Push Up Fed Rate Hike Expectations, How Will US Stocks, Dollar, Gold React?
- Gold Drops Below $4,300 Erasing Year-to-Date Gains. This Week’s CPI May Ignite Rate Hike Expectations Will Gold Still Rise in 2026?

Silver attracts some dip-buying on Tuesday and snaps a three-day losing streak.
The mixed oscillators on the daily chart warrant some caution for bullish traders.
Weakness below the Asian session low might expose the 100-day EMA support.
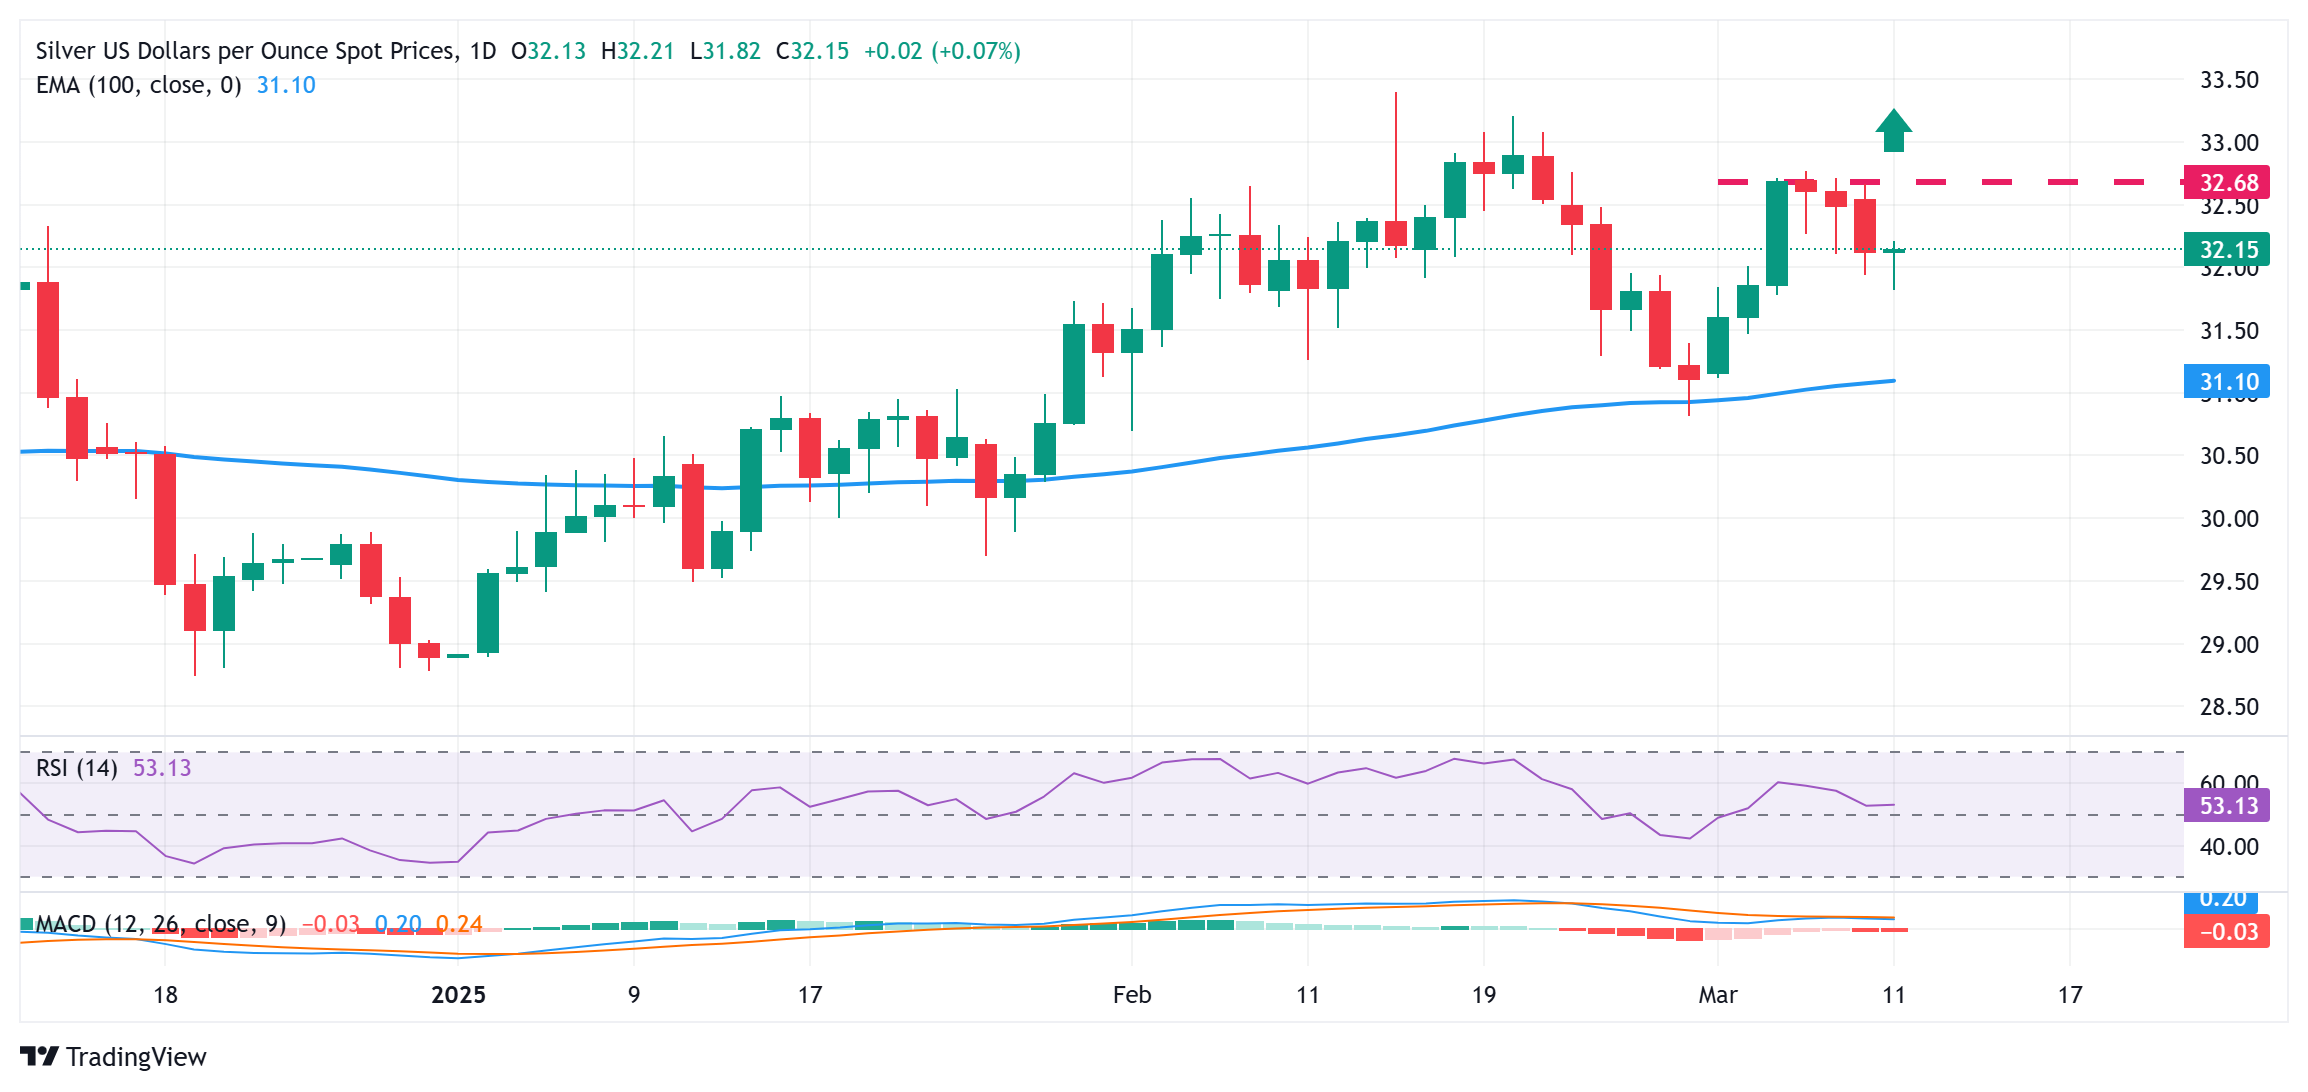
Silver (XAG/USD) reverses an Asian session dip to the $31.85-$31.80 region, or a four-day low, and climbs to a fresh daily high in the last hour. The white metal currently trades around the $32.15-$32.20 area, up nearly 0.20% for the day, and for now, seems to have snapped a three-day losing streak.
However, mixed technical indicators on the daily chart warrant some caution for bullish traders and positioning for a further appreciating move. Hence, any subsequent move up could face stiff resistance and remain capped near the $32.65-$32.70 region. The said hurdle might now act as a key pivotal point, which if cleared decisively could allow the XAG/USD to reclaim the $33.00 mark and climb further towards the February monthly swing high around the $33.40 area.
Some follow-through buying should pave the way for additional gains towards the next relevant hurdle near the $33.60-$33.70 area. The XAG/USD might then surpass the $34.00 round figure and extend the momentum further towards the $34.50-$34.55 resistance zone before aiming to challenge the multi-year high, closer to the $35.00 psychological mark touched in October 2024.
On the flip side, the Asian session low, around the $31.85-$31.80 region, could offer some support, below which the XAG/USD could slide to the $31.25-$31.20 area. The downward trajectory might eventually drag the XAG/USD to the 100-day Exponential Moving Average (EMA) pivotal support, currently pegged near the $31.10-$31.00 region. This is followed by the late February low, around the $30.80 area, which if broken might shift the bias in favor of bearish traders.
The subsequent downfall has the potential to drag the XAG/USD towards the $30.00 psychological mark en route to the $29.55-$29.50 support and sub-$29.00 levels, or the year-to-date low touched in January.
XAG/USD daily chart
Read more
* The content presented above, whether from a third party or not, is considered as general advice only. This article should not be construed as containing investment advice, investment recommendations, an offer of or solicitation for any transactions in financial instruments.


