

Silver Price Forecast: XAG/USD holds steady above mid-$32.00s, over one-week top

- Gold Price Forecast: Gold Poised to Break $4,200 as Oil Price Slump Eases Inflation Fears
- Gold Price Forecast: Oil Price Breaking $100 Fuels Inflation Concerns, Will Gold Prices Fall Further?
- Gold Price Trend Forecast: Expectations of Easing US-Iran Tensions Boost Gold Prices, $4,070 Becomes Key Level for Bulls and Bears
- Gold rallies to over two-week high, eyes $4,150 as traders track US-Iran diplomacy efforts
- Middle East War updates: US-Iran pause strikes as Trump weighs up diplomatic options
- Euro declines to near 1.1400 as US launches fresh strikes on Iran
Silver consolidates in a range as bulls opt to wait for the release of the US NFP report.
The setup suggests that the path of least resistance for the XAU/USD is to the upside.
Any corrective pullback might still be seen as a buying opportunity and remain limited.
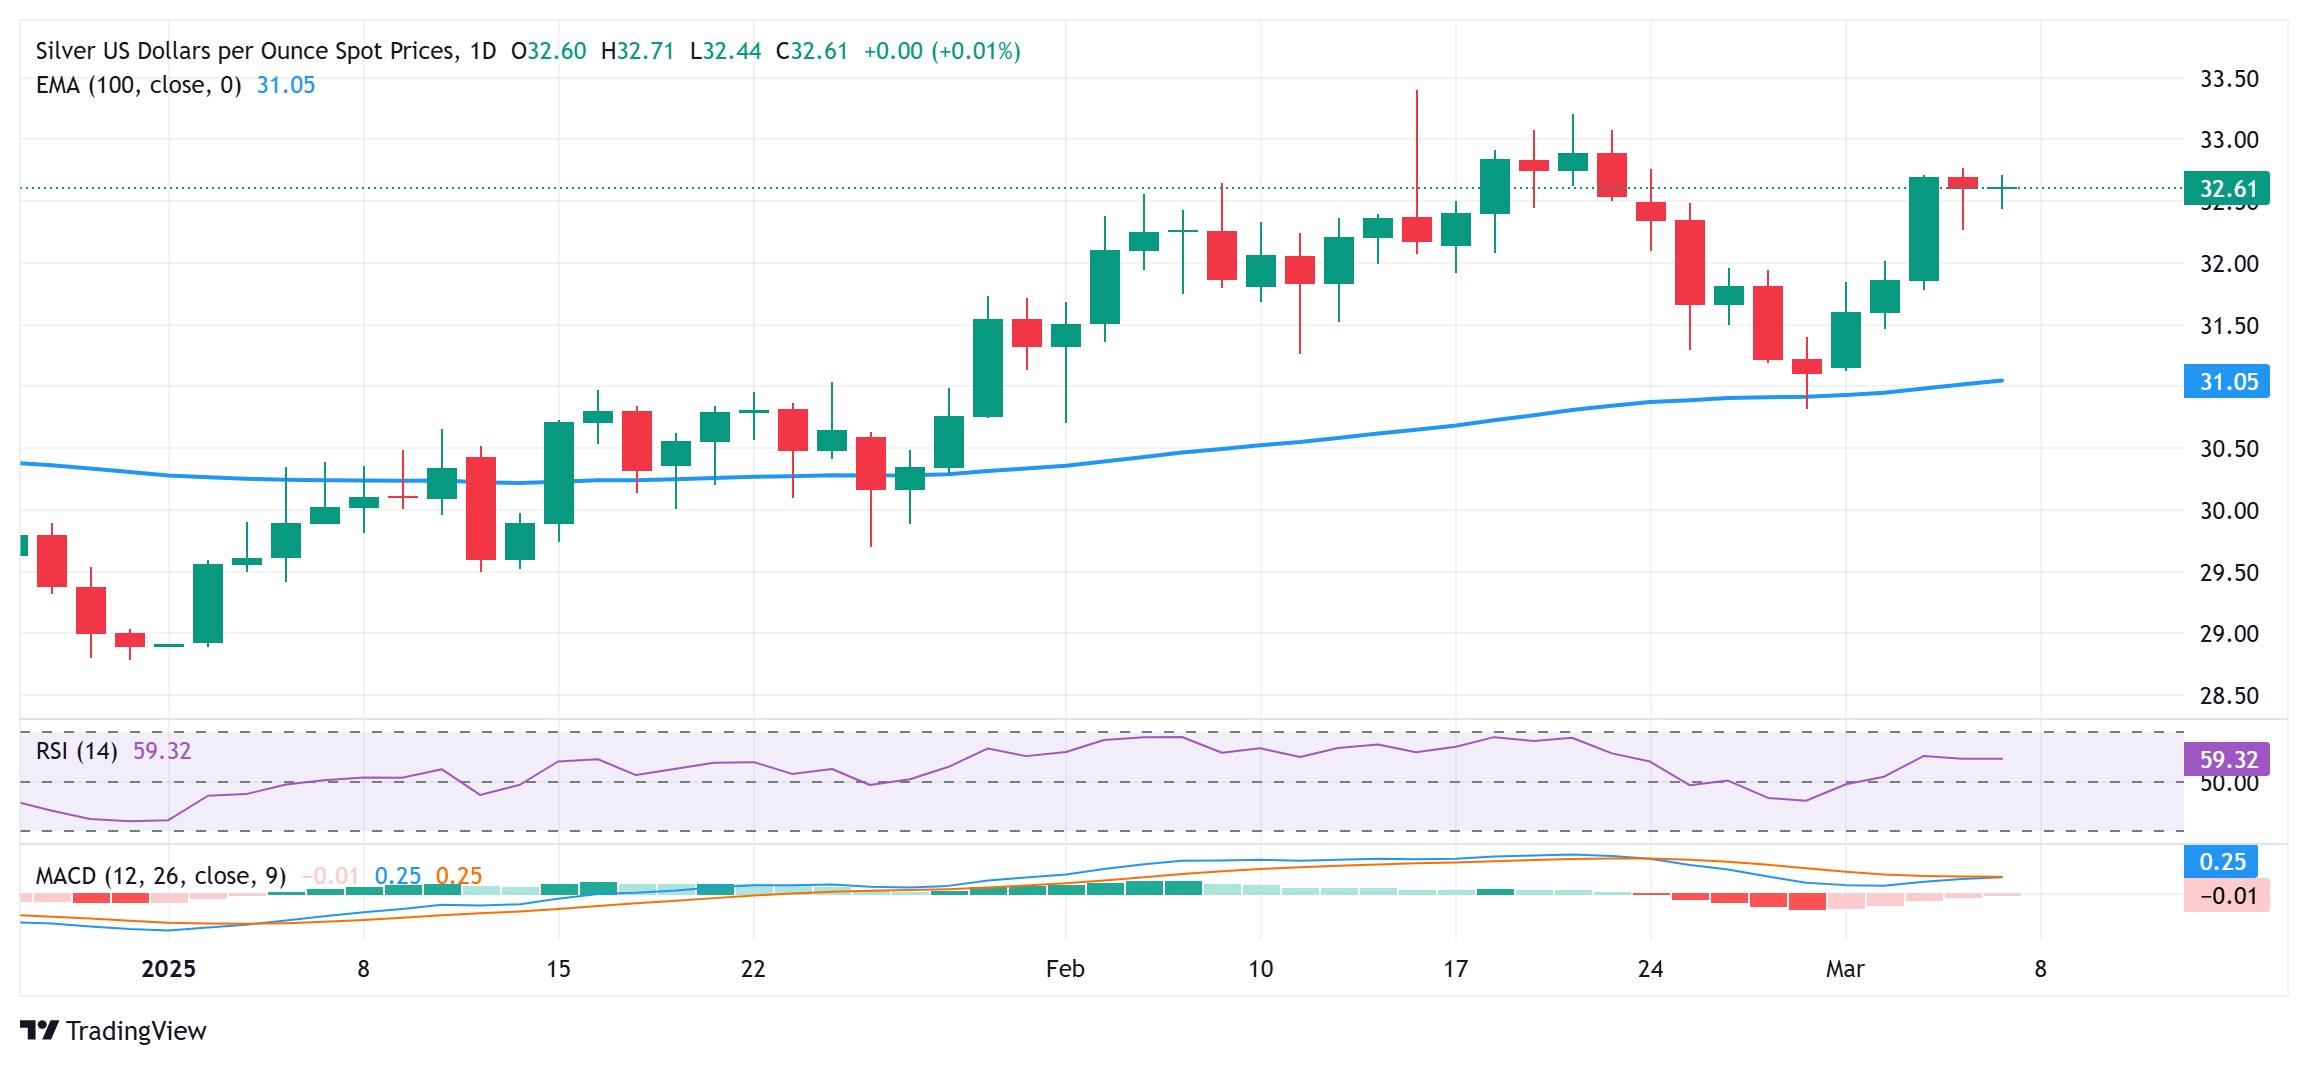
Silver (XAG/USD) oscillates in a narrow band during the Asian session on Friday and currently trades above mid-$32.00s, near its highest level in over a week touched the previous day. Moreover, the near-term bias seems tilted in favor of bullish traders and supports prospects for an extension of the weekly uptrend.
The recent bounce from sub-$31.00 levels, nearing the 100-day Exponential Moving Average (EMA), and the fact that oscillators on the daily chart have just started gaining positive traction validate the constructive outlook for the XAG/USD. Hence, some follow-through strength beyond the $33.00 mark, towards the February monthly swing high around the $33.40 area, looks like a distinct possibility.
The momentum could extend further towards the next relevant hurdle near the $33.60-$33.70 area before the XAG/USD climbs further towards the $34.00 round figure en route to the $34.50-$34.55 resistance zone. The white metal might then aim towards challenging a multi-year high, closer to the $35.00 psychological mark touched in October 2024.
On the flip side, the $32.30-$32.25 horizontal resistance breakpoint, which coincides with the overnight swing low, might still protect the immediate downside ahead of the $32.00 mark. This is followed by the $31.80 area, below which the XAG/USD could decline to the $31.25-$31.20 region en route to the 100-day EMA, currently pegged near the $31.10-$31.00 area and last week's swing low, around the $30.80 area.
A convincing break below the latter would shift the bias in favor of bearish traders and drag the XAG/USD towards the $30.00 psychological mark en route to the $29.55-$29.50 support and sub-$29.00 levels, or the year-to-date low touched in January.
Silver daily chart
Read more
* The content presented above, whether from a third party or not, is considered as general advice only. This article should not be construed as containing investment advice, investment recommendations, an offer of or solicitation for any transactions in financial instruments.


