


Silver Price Analysis: XAG/USD stabilizes around $30.50 as bulls and bears battle

■Silver steadies following Monday’s drop below $31.00, showing slight recovery.
■RSI indicates upward momentum with potential for a ‘double bottom’ breakout if $31.00 is cleared.
■Key resistance at $32.29 and YTD high of $32.51; support at $30.18 and $28.57 if sellers take control.
Silver price stabilizes above the $30.50 area for the second straight day, following Monday’s losses of more than 1.20% that tumbled the grey’s metal price beneath the $31.00 figure. At the time of writing, the XAG/USD traded at $30.79 and gained some 0.03% on Tuesday.
XAG/USD Price Analysis: Technical outlook
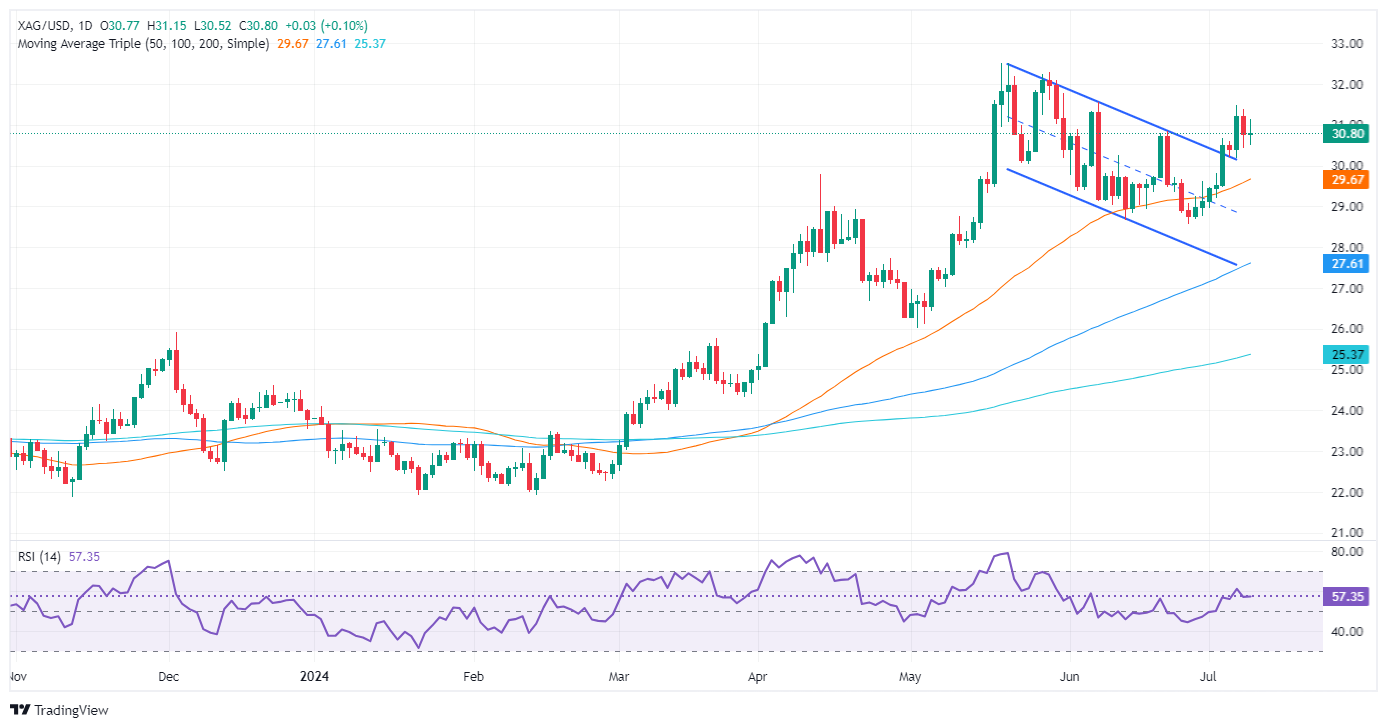
Silver remains upward biased, with momentum backing buyers, as shown by the Relative Strength Index (RSI). Further, a ‘double bottom’ looms, though the tug-of-war between bulls and bears around the crucial June 21 high turned support at $30.84 remains, keeping buyers at bay.
However, if they clear the $31.00 mark, the next resistance would be the May 29 high at 32.29, ahead of testing the year-to-date (YTD) high of $32.51. A breach of the latter will expose the psychological $33.00 figure.
Conversely, if sellers drag XAG/USD’s price below the July 5 low of $30.18, that will expose the $30.00 mark. Once hurdle, the next stop would be the June 26 last cycle low at $28.57.
XAG/USD Price Action – Daily Chart
Read more
* The content presented above, whether from a third party or not, is considered as general advice only. This article should not be construed as containing investment advice, investment recommendations, an offer of or solicitation for any transactions in financial instruments.


