


Silver Price Analysis: XAG/USD retreats amid strong US Dollar

■Silver drops in late trading, impacted by a strong US Dollar and falling Treasury yields.
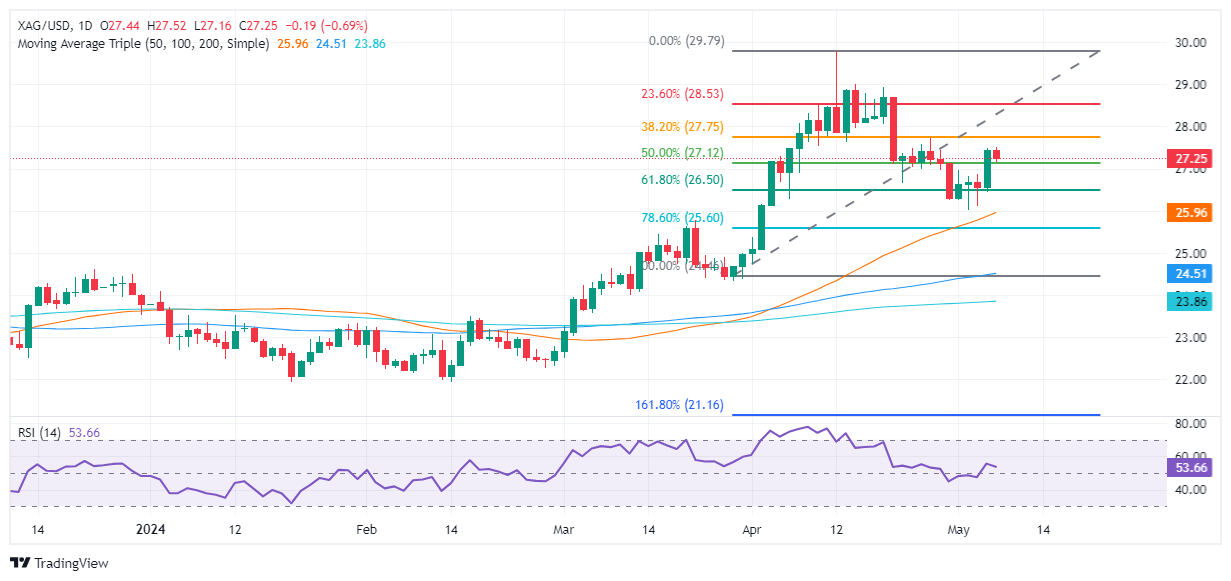
■Remains technically bullish, trading within key Fibonacci levels from $24.33 to $29.78.
■Resistance at $27.70, support at $27.05; market trends could push price to $28.00 or below $27.00.
Silver price slid late in the North American session due to overall US Dollar strength across the board amid falling US Treasury yields. Despite that, the XAG/USD trades at $27.23, down 0.71%.
XAG/USD Price Analysis: Technical outlook
The grey metal remains upward-biased despite retreating toward the $27.20 area on Tuesday. It should be said that XAG/USD is still trading within the 50% and 38.2% Fibonacci retracements, drawn from the latest cycle low and high, each at $24.33 and $29.78, respectively.
If Silver buyers would like to regain control, they must clear the 38.2% Fibo retracement at $27.70. Once surpassed, emerge key resistance levels, like the $28.00 psychological figure, followed by the 23.6% Fibo retracement at $28.49 ahead of $29.00.
On the flip side, if sellers want to push prices lower, they must drag prices below the 50% Fibo retracement at $27.05. Once done, sellers must clear $27.00, followed by the confluence of the May 2 low and the 50-day moving average (DMA) at $26.02/08.
XAG/USD Price Action – Daily Chart
Read more
* The content presented above, whether from a third party or not, is considered as general advice only. This article should not be construed as containing investment advice, investment recommendations, an offer of or solicitation for any transactions in financial instruments.


