

Silver Price Analysis: XAG/USD clings to $28.00 amid high US yields

- Gold Price Forecast: Gold Poised to Break $4,200 as Oil Price Slump Eases Inflation Fears
- Gold declines despite easing concerns over inflation, interest rate hikes
- Fed Decision Eve: 104 Economists Expect No Change; Why Is Citadel Securities Betting on a Surprise Hike?
- Gold Price Forecast: Can Gold Hold $4,020 as Fed Rate Hike Expectations Rise?
- Middle East War updates: US-Iran pause strikes as Trump weighs up diplomatic options
- WTI Oil flirts with the $80 level amid speculation about US-Iran peace talks

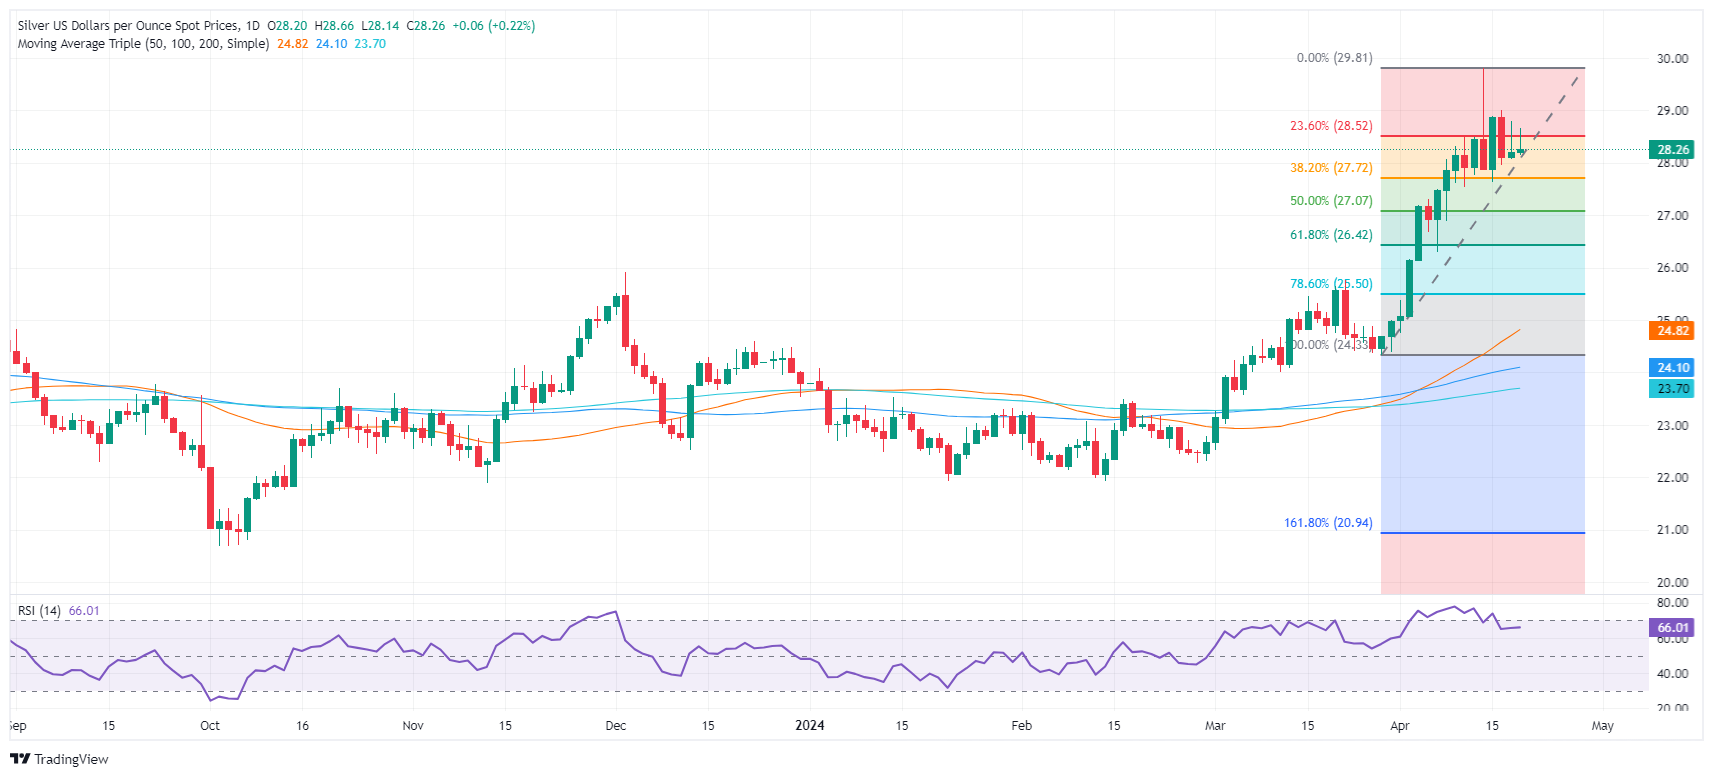
■Silver maintains modest gains supported by a still-bullish market sentiment despite high US Treasury yields.
■Technical outlook favorable as the Relative Strength Index (RSI) indicates buying activity despite a slight dip.
■Potential resistance and breakout points set at $28.75 and $29.00, with eyes on surpassing the year-to-date high of $29.79.
Silver clings to modest gains of 0.29% and stays above $28.00 for the sixth consecutive trading day amid higher US Treasury bond yields and a strong US Dollar. At the time of writing, the XAG/USD trades at $28.30 after hitting a daily low of $28.14.
XAG/USD Price Analysis: Technical outlook
The grey metal continues to hold to the $28.00 threshold, while the Relative Strength Index (RSI) continues to edge lower. One could assume that buyers are taking a respite as the RSI edges lower, but it remains above the latest through of 54.00. With that said, Silver remains upward-biased as momentum favors bulls.
If XAG/USD buyers reclaim the May 18, 2021, daily high at $28.75, they could challenge $29.00. A breach of the latter will expose the year-to-date (YTD) high at $29.79 before challenging $30.00.
Otherwise, Silver’s drop below $28.00 would give sellers the upper hand and expose key support levels. Firstly, the April 15 daily low at $27.59, followed by the confluence of the 50% Fibo retracement and the $27.00 figure.
XAG/USD Price Action – Daily Chart
Read more
* The content presented above, whether from a third party or not, is considered as general advice only. This article should not be construed as containing investment advice, investment recommendations, an offer of or solicitation for any transactions in financial instruments.


