


Fortinet Stock Forecast: FTNT Set to Gap Toward $129 as Price-Driven Growth Fades
TradingKey - Fortinet (NASDAQ: FTNT) fell 5.90% to $174.08 on Wednesday, October 28, and then dropped about 25% after hours once it reported third-quarter results. Premarket quotes on Thursday, October 29, sat near $129.00, which would erase months of gains in one session for a stock that hit a 52-week high of $197.13 this year.
During the regular-session slide, Newsquawk carried an unconfirmed headline attributing the pressure to a cyber breach. Fortinet has not confirmed any breach, and the much bigger after-hours drop followed the earnings report itself.
The Headline Numbers Beat
Revenue rose 20% to $2.08 billion, above the $2.06 billion expected, and product revenue jumped 37% to $765 million. Billings, the value of new invoices sent to customers, rose 29% to $2.34 billion. Non-GAAP EPS, which excludes items such as stock-based pay, rose 23% to $0.91 against $0.86 expected, and the non-GAAP operating margin hit 38.2%.
Free cash flow, the cash left after operating costs and capital spending, rose about 52% to $865 million. Fortinet also added $1.2 billion to its buyback, leaving $2 billion available.
Gross Margin Showed the Cost Problem
Non-GAAP gross margin, the share of revenue left after the cost of making its products and services, fell to 79.6% from 81.6% a year earlier. CFO Christiane Ohlgart said the first half benefited from cheaper inventory bought before Fortinet raised prices, but in the third quarter "the costs are creeping up and then impacting the product gross margin." Fortinet guided fourth-quarter gross margin to 78% to 80%.
Price Hikes Did Much of the Work
The bigger issue is where the growth came from. Fortinet said price increases added about 10 percentage points to billings growth, and CEO Ken Xie said pricing has "probably stabilized, but not improved yet." So about a third of the 29% billings growth came from charging more, not selling more.
Fortinet's guidance shows that boost fading, with fourth-quarter billings growth slowing to about 20% at the midpoint and revenue growth to about 15%. Fortinet also cut its 2026 service revenue forecast, the recurring part of the business, by about $40 million to $5.15 billion to $5.17 billion, its first cut this year.
Guidance Raised, but Barely
Fortinet raised its 2026 outlook for the third time, to billings of $9.568 billion to $9.718 billion, revenue of $8.125 billion to $8.215 billion and non-GAAP EPS of $3.54 to $3.58. The EPS range sits above the $3.45 consensus, and the fourth-quarter revenue guide is slightly above estimates. Even so, StockTitan calculated that the revenue raise was the smallest of the three this year.
The guide beat estimates, yet investors repriced Fortinet because the growth now looks more like price than volume. Ohlgart said service revenue should grow faster in 2027, and SASE firewall billings rose 31%, but that was not enough to change the mood.
Peers Fell Too, and Analysts Were Already Cautious
The drop also hit peers after hours, with Palo Alto Networks, CrowdStrike and Zscaler reported down about 6% to 7%. Analysts were already cautious, with a Hold consensus from 44 analysts and an average target of about $169, below Wednesday's close.
Fortinet Technical Analysis: Recovery Above $143.99 Needed to Calm Selling
That repricing would show at Thursday's open on the daily chart. A gap to $129 would break the rising trendline from April, a line drawn under the stock's higher lows, and push price well below both moving averages, which track the average price over a set period. That would turn the trend bearish in a single session and leave a wide gap on the chart between $129 and Wednesday's close near $174.
RSI, a momentum gauge that runs from 0 to 100, sits near 46 but is likely to fall quickly if the premarket losses carry into the open.
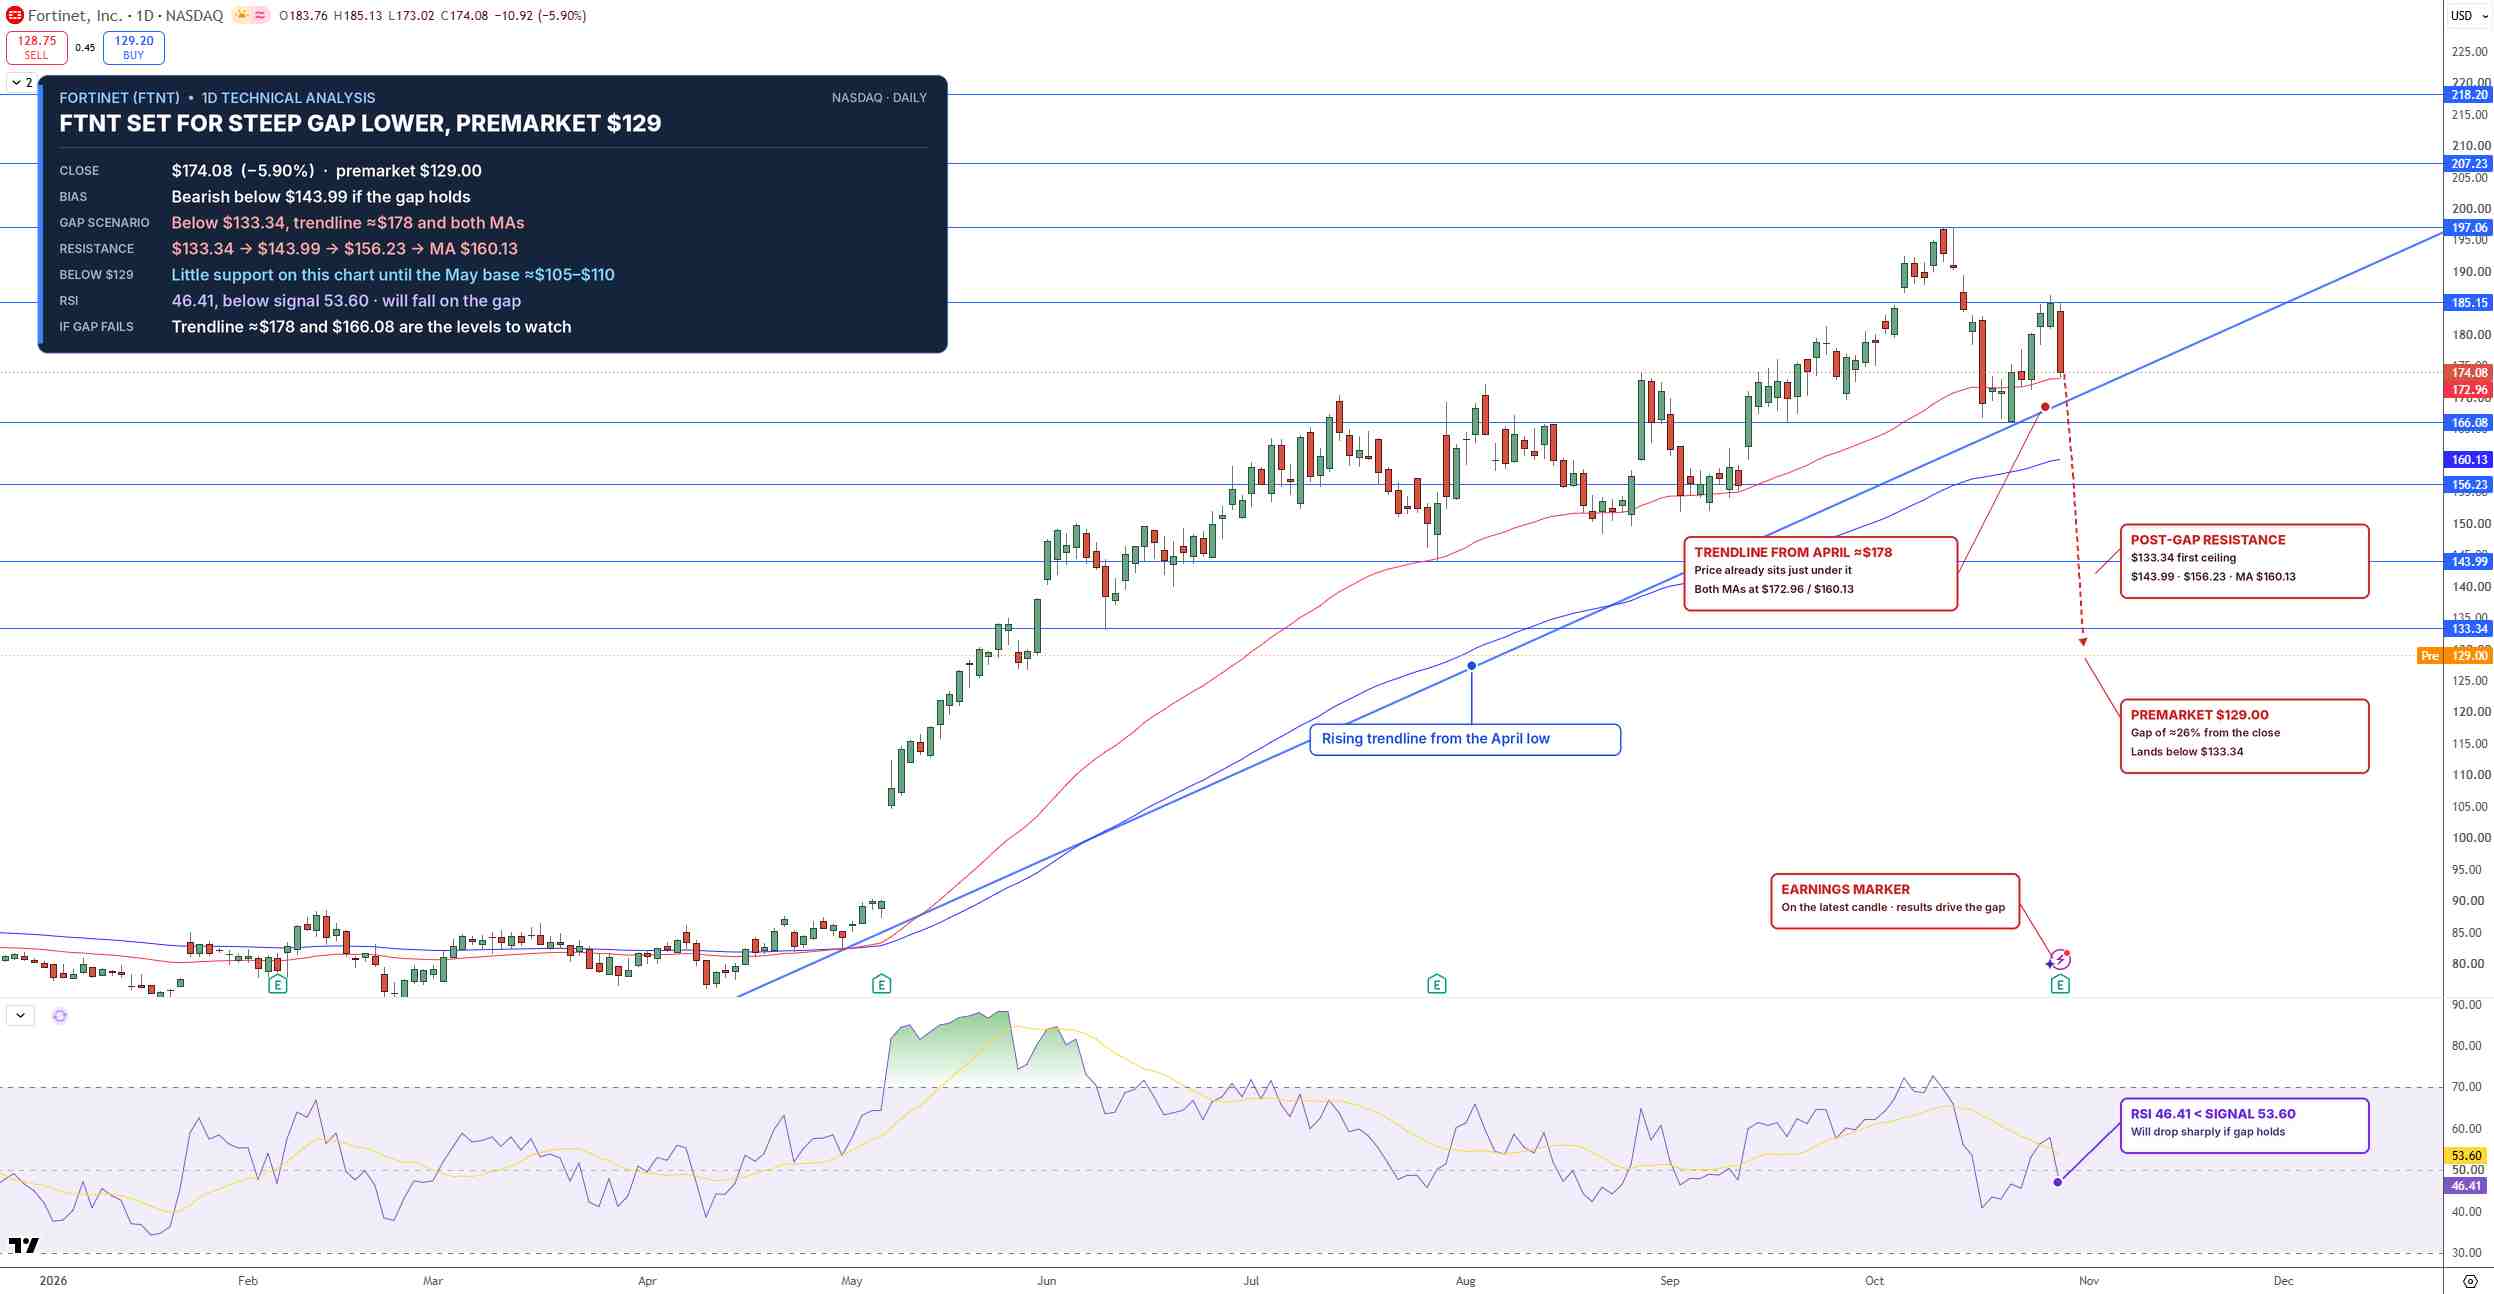
FTNT Price Chart - Source: Tradingview
After a gap to $129, $133.34 would act as the first resistance, a level where sellers are likely to return. Buyers would need a recovery above $143.99 to calm the selling, with $156.23 as the next hurdle.
I'm bearish while FTNT stays below $143.99, and the stock would need to reclaim $156.23 to improve the outlook.
Key Levels
- Last close: $174.08, down 5.90% on October 28
- Support: $129.00, the premarket level
- Resistance: $133.34, $143.99, $156.23, $160.13, $172.96
- RSI: 46.41, likely to fall at the open
- Bullish trigger: Daily close above $143.99
- Bearish trigger: Failure to hold $129.00 after the open
FAQs
Why is Fortinet stock falling after earnings?
Fortinet beat on revenue and EPS, but gross margin fell to 79.6% as component costs rose, and about 10 points of its 29% billings growth came from price increases that have now stalled. Guidance points to fourth-quarter billings growth slowing to about 20%.
What is the Fortinet stock forecast now?
The bias is bearish below $143.99. If the gap toward $129 holds, $133.34 becomes the first resistance, and FTNT would need to reclaim $156.23 to improve the outlook.
Bottom Line
Fortinet's quarter beat estimates, but investors now see growth that leaned on price hikes just as costs are rising. The level that matters is $143.99. In my view, the stock stays under pressure below it after the gap, and only a recovery above $156.23 would repair the chart.
Recommended Articles


