Bitcoin is back above $80,000 — but 75% of the bounce was shorts, not buyers

coverImg
Source: DepositPhotos

Bitcoin is trading at $80,669, back above the $80,000 line it lost over the weekend. The move looks like a recovery. The positioning says it is a squeeze: 75.4% of the last 24 hours of futures liquidations were shorts, CME open interest fell 36,545 BTC in October, and spot ETFs lost $773.5 million on October 22-23. Price went up because sellers were forced out, not because buyers arrived.
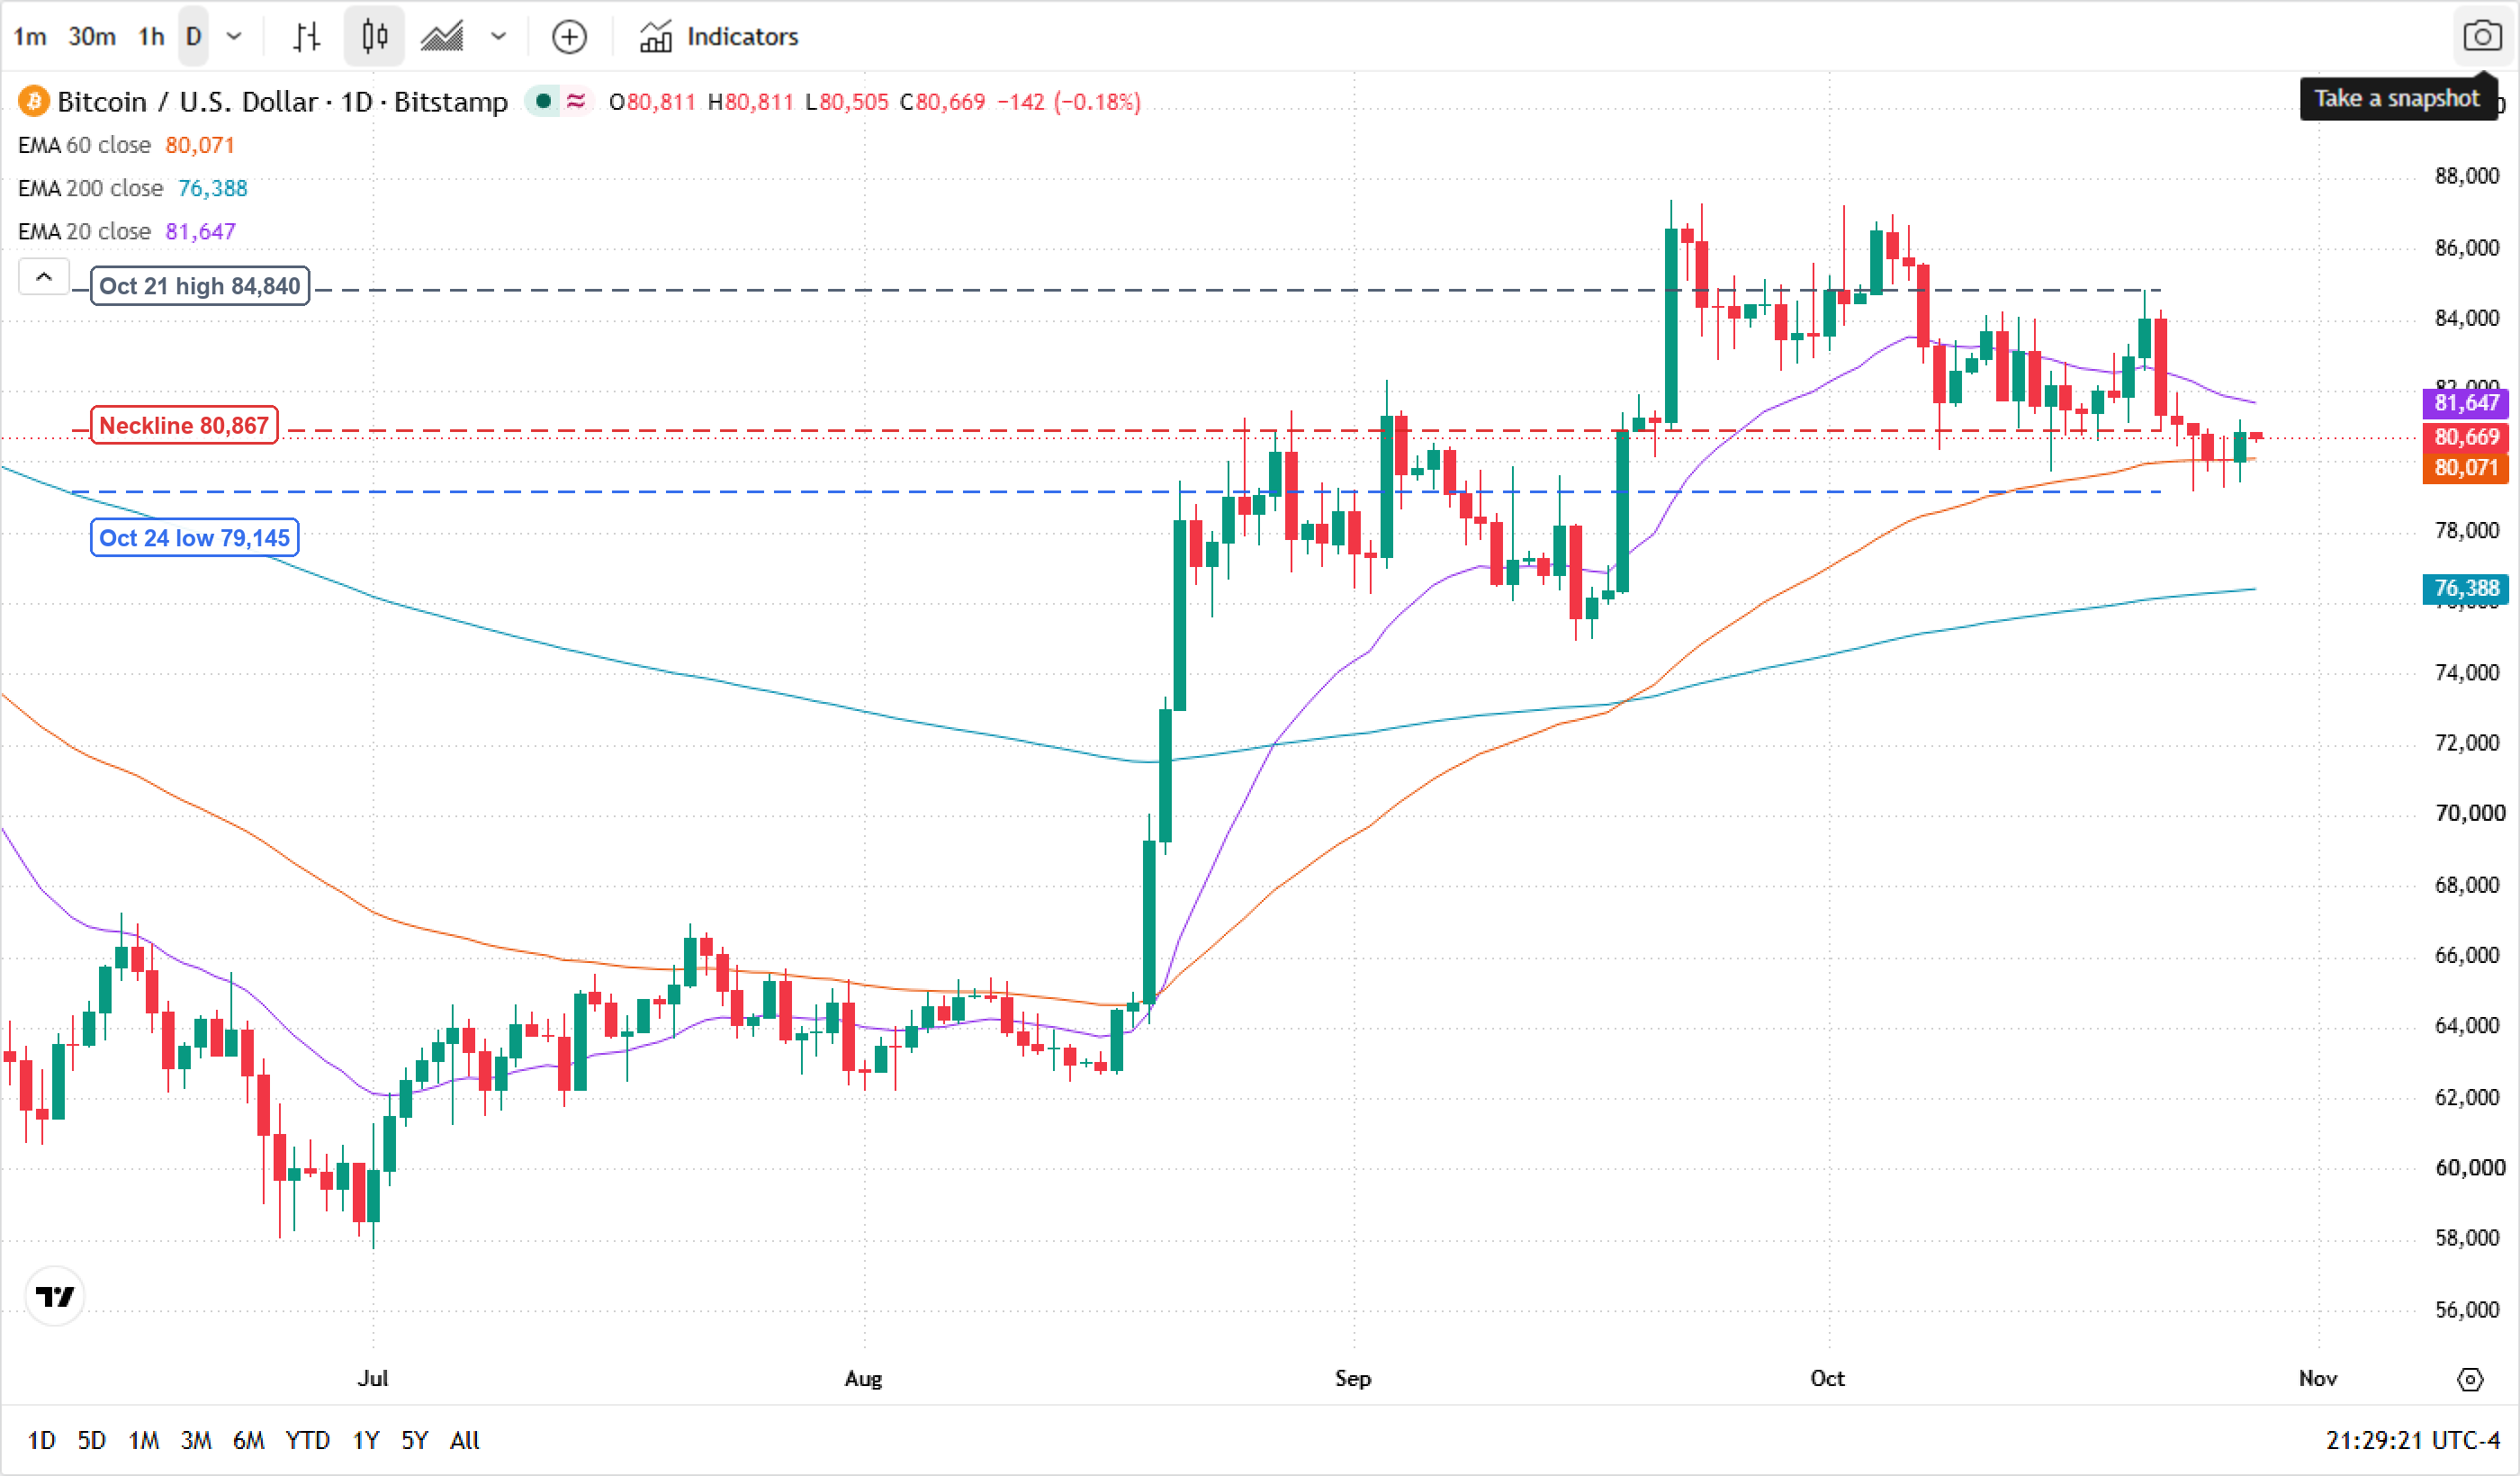
Bitcoin daily chart on October 28, 2026, with price at $80,669, the EMA20 at $81,647, the EMA60 at $80,071 and the EMA200 at $76,388 * Chart source: TradingView (BITSTAMP:BTCUSD, daily, New York time)

The bounce was a squeeze

The sequence matters. Bitcoin peaked at $84,840 on October 21 and slid to a low of $79,145 on October 24. The break below $80,000 triggered $154.23 million in crypto-wide liquidations across more than 62,000 traders, with $117.99 million of that longs — that was the flush.

The rebound since then has been the mirror image. Over the last 24 hours, CoinGlass shows $34.52 million in futures liquidations, and $26.04 million — 75.4% — were shorts. Yuanta Securities called it "short covering, not demand." That is the difference between a bottom and a bounce: a bottom is built by new buyers; a bounce is built by old sellers running out of room.

$80,669, with the EMA20 still overhead

The chart tells the same story. Price is above the EMA60 at $80,071 and far above the EMA200 at $76,388, but it is still below the EMA20 at $81,647. In other words, the short-term trend is still down, the medium-term trend is flat, and the long-term trend is up. A squeeze can lift price to the EMA20; it rarely lifts it through the EMA20 without new demand.

The cost basis band: $80,000-81,500

Glassnode puts the cost basis for ETF holders and treasury companies at $80,000-81,500. That is the band where the marginal holder is neither in profit nor in loss — and it is exactly where price is now. Above it, holders relax; below it, the same holders become sellers. The EMA20 at $81,647 sits just above that band, which makes $81,500-82,000 the first real test.

Three numbers that do not match the price

$773.5 million left the ETFs.

On October 22, spot Bitcoin ETFs saw $635.6 million in net outflows — the largest single day since June 2025. Another $137.9 million left on October 23. BlackRock's IBIT and Fidelity's FBTC accounted for $471.6 million of the October 22 outflow.

Flows did turn on October 26, with $110.3 million of net inflows, all into IBIT. But one day does not reverse a month: October month-to-date is still net negative, between $202 million and $314 million depending on the data provider.

36,545 contracts left the CME.

CME open interest fell 36,545 BTC in October. That is leverage leaving the market, not entering it. When price falls and open interest falls with it, the move is being driven by position reduction — the opposite of a new trend being built.

90,800 BTC left long-term holders.

Long-term holders shed 90,800 BTC during the same period. This is the quiet part: the coins are not disappearing, they are changing hands from strong hands to weaker ones. The Fear & Greed Index fell to 43 from 51 a week ago — fear, but not capitulation.

What would turn the squeeze into a re-rating

The next 72 hours are unusually dense: the FOMC decision tonight, PCE on October 29, and a $11 billion Bitcoin options expiry on October 30. Any of them can change the flow picture. Here is the checklist:

What to watchWhy it mattersThe threshold
Spot ETF daily flowsThe only measure of new spot demandThree consecutive days of net inflows, not one
CME open interestWhether leverage is returningA weekly increase above 20,000 BTC
The $81,500-82,000 bandETF and treasury cost basis plus the EMA20A daily close above $82,000
$79,145The October 24 lowA close below it invalidates the squeeze thesis

The counter-evidence deserves equal weight: Bitcoin is still above the EMA60 and EMA200, ETF flows turned positive on October 26, and a Fed hold with softer PCE would remove the macro headwind. If price closes above $82,000 and ETF inflows persist for three sessions, the squeeze becomes a re-rating.

Until then, the honest description is this: price is up, positioning is down, and the market is borrowing strength from shorts rather than earning it from buyers.

Read more

  • Bitcoin Plunges 13% in a Week as Market Retreats to $60,000 Level
  • Note: If you want to share the article 《Bitcoin is back above $80,000 — but 75% of the bounce was shorts, not buyers》, make sure you retain the original link. For more information, please visit Insights or browse www.mitrade.com.

    * The content presented above, whether from a third party or not, is considered as general advice only.  This article should not be construed as containing investment advice, investment recommendations, an offer of or solicitation for any transactions in financial instruments.

    goTop
    quote
    Related Articles
    placeholder
    Bitcoin Plunges 13% in a Week as Market Retreats to $60,000 LevelBitcoin plunged 13% over the past seven days as bullish defense lines crumbled in succession, officially kicking off the battle to defend the $60,000 mark.On November 16, following a viol
    Author  TradingKey
    Yesterday 10: 05
    Bitcoin plunged 13% over the past seven days as bullish defense lines crumbled in succession, officially kicking off the battle to defend the $60,000 mark.On November 16, following a viol
    placeholder
    Bitcoin lost its 200-day average — but the exit started three sessions before the CPIBitcoin fell 2.5% to about $73,400 on 11 November, an 11-week low, breaking its 200-day moving average near $73,100. The 24-hour liquidation tally reached $632 to $705 million, roughly 82% of it longs. But spot ETF outflows began three sessions earlier and USDT's market cap has shrunk $6.6 billion in 60 days — the leveraged length left before the inflation print did. A double top at 81,890 and 81,080 leaves a measured target of 69,366.
    Author  Suzie
    Nov 11, Wed
    Bitcoin fell 2.5% to about $73,400 on 11 November, an 11-week low, breaking its 200-day moving average near $73,100. The 24-hour liquidation tally reached $632 to $705 million, roughly 82% of it longs. But spot ETF outflows began three sessions earlier and USDT's market cap has shrunk $6.6 billion in 60 days — the leveraged length left before the inflation print did. A double top at 81,890 and 81,080 leaves a measured target of 69,366.
    placeholder
    Bitcoin ETFs sold $1.28 billion in a week — and BTC is still above 75,000US spot Bitcoin ETFs logged $1.28 billion of net outflows in the week to Nov 6, the largest since late June, with BlackRock's IBIT accounting for $1.21 billion. Yet BTC only fell from $80,405 to $74,940, a 6.8% move. The gap between the fund flow and the price is the story: leveraged longs were flushed, but spot holders did not follow the ETFs out — and $75,000 is the line that decides whether that reading holds.
    Author  Suzie
    Nov 09, Mon
    US spot Bitcoin ETFs logged $1.28 billion of net outflows in the week to Nov 6, the largest since late June, with BlackRock's IBIT accounting for $1.21 billion. Yet BTC only fell from $80,405 to $74,940, a 6.8% move. The gap between the fund flow and the price is the story: leveraged longs were flushed, but spot holders did not follow the ETFs out — and $75,000 is the line that decides whether that reading holds.
    placeholder
    Binance replaced 95% of a $6.3bn hole — Bitcoin is trading the plumbing, not the coinBinance resumed withdrawals on November 1 after a record $6.3bn theft. In the first 9.5 hours, users withdrew $4.64bn and deposited $1.01bn, a net outflow of $3.64bn, or 2.1% of assets. Bitcoin fell to 76,173 and is now 78,473. The market is pricing the exchange, not the supply.
    Author  Suzie
    Nov 02, Mon
    Binance resumed withdrawals on November 1 after a record $6.3bn theft. In the first 9.5 hours, users withdrew $4.64bn and deposited $1.01bn, a net outflow of $3.64bn, or 2.1% of assets. Bitcoin fell to 76,173 and is now 78,473. The market is pricing the exchange, not the supply.
    placeholder
    Bitcoin's double top at $88,000: why $78,000 is the line that decides the next moveBitcoin trades near $82,500 (+0.47%) after twice failing at the $88,000 area, forming a potential double top with a neckline at $78,000. A break below the neckline would project a measured target near $68,200; a close back above $88,000 would invalidate the pattern. Here are the structure, the levels and what would confirm either side.
    Author  Suzie
    Oct 19, Mon
    Bitcoin trades near $82,500 (+0.47%) after twice failing at the $88,000 area, forming a potential double top with a neckline at $78,000. A break below the neckline would project a measured target near $68,200; a close back above $88,000 would invalidate the pattern. Here are the structure, the levels and what would confirm either side.
    Live Quotes
    Name / SymbolChart% Change / Price
    BTCUSD
    BTCUSD
    0.00%0.00

    Bitcoin Related Articles

    • Bitcoin Leverage And Margin Trading in 2026: The Ultimate Beginner's Guide
    • Gold vs Bitcoin 2026: Which Is the Better Investment?Best Hedge Asset Comparison
    • Best Strategies When BTC Price Drops: From Hedging to Accumulating
    • How to Day Trade Crypto? Simplest Day Trading Strategy Ever
    • Bitcoin Price Prediction 2026-2030: Long-Term Outlook Driven by Data & Macro Cycles
    • Bitcoin Mining Beginner Guide: What Is Bitcoin Mining and How to Mine Bitcoin?

    Click to view more