


Dollar presses 102 as the 10-year yield sits at 5.14% — and October hike odds are only 17%

Mitrade Insights — The dollar and Treasury yields rose together on Monday, but not for the reason most traders would assume. The US Dollar Index closed at 101.99 (+0.20%) after briefly topping 102.07, while the 10-year Treasury yield climbed to 5.14% (+6.5bp) and the 2-year reached 4.774%. Yet futures still assign only about a 17% probability to a hike at the October 27-28 FOMC, with roughly 90% odds of a move by December. If the Fed is not the driver, what is?
1. The move: dollar firm, curve higher
| Asset | Level | Change |
|---|---|---|
| DXY | 101.99 | +0.20% (high 102.07) |
| US 10-year yield | 5.14% | +6.5bp (high 5.15%) |
| US 2-year yield | 4.774% | +6.8bp |
| US 30-year yield | 5.47% | +4.8bp |
| EUR/USD | 1.1183 | weaker |
| USD/JPY | 158.5 | near intervention zone |
The move is not a simple "hot inflation, hawkish Fed" story. October hike odds actually fell from roughly 47% ~ 50% after the September CPI print to about 17% after Fed Chair Kevin Warsh declined to signal an October move. December odds stayed near 90%, so markets are pricing a delay, not the end of the tightening cycle.
2. Why yields rose without the Fed
The push came from the long end, and from outside the US. France's 10-year OAT yield jumped to 4.84% ~ 4.94%, near its highest in more than two decades, as the 2027 budget process and a ratings review kept fiscal risk in focus. The OAT-Bund spread widened to 140 ~ 146bp, a two-week high and a level associated with euro-area stress. French debt-to-GDP is around 119%, and the budget includes about €43 billion of deficit-reduction measures.
That matters for US yields for two reasons. First, a global bond selloff lifts term premiums everywhere; the 10-year yield had already touched 5.31% on October 7, its highest since 2002, before easing to 5.14%. Second, Brent crude near $109.6 keeps inflation and policy risk elevated, even as growth data cool. In other words, the curve is being pushed by supply, oil and term premium — not by a fresh Fed hike signal.
3. The dollar channel
A higher long-end yield with a patient Fed is dollar-supportive, but the effect is relative. The euro weakened to 1.1183 as French bonds sold off, doing much of the dollar index's work. USD/JPY held near 158.5, below the 159 level that has acted as an intervention watch zone; Bank of Japan Governor Kazuo Ueda said underlying inflation is "quite close" to the 2% target, keeping a gradual normalization path alive ahead of the October 29-30 BOJ meeting.
The dollar index is now pressing against the top of its recent range. 102.95 is the 52-week high; 102.00 is the round-number gate it briefly cleared on Monday; 101.50 is the first support, with 101.80 as the near-term shelf.
4. Cross-asset read-through
The rise in real yields is a valuation headwind for long-duration assets. Gold slipped to about $4,149, pressured by the firmer dollar and higher yields, though it remains well above its October lows. Equities were mixed: the Nasdaq rose 1.11% and the S&P 500 added 0.41% as chip stocks rebounded, but the Dow slipped 0.07%. The market is balancing a tech-led rebound against a discount rate that is still above 5%.
The key asymmetry: if the 10-year yield breaks back above 5.31%, the equity rebound will be tested and the dollar's rate support will strengthen. If yields ease back toward 5.00% without a growth scare, the dollar's upside fades and gold gets room to retest $4,200.
5. Levels: 102.00 is the gate
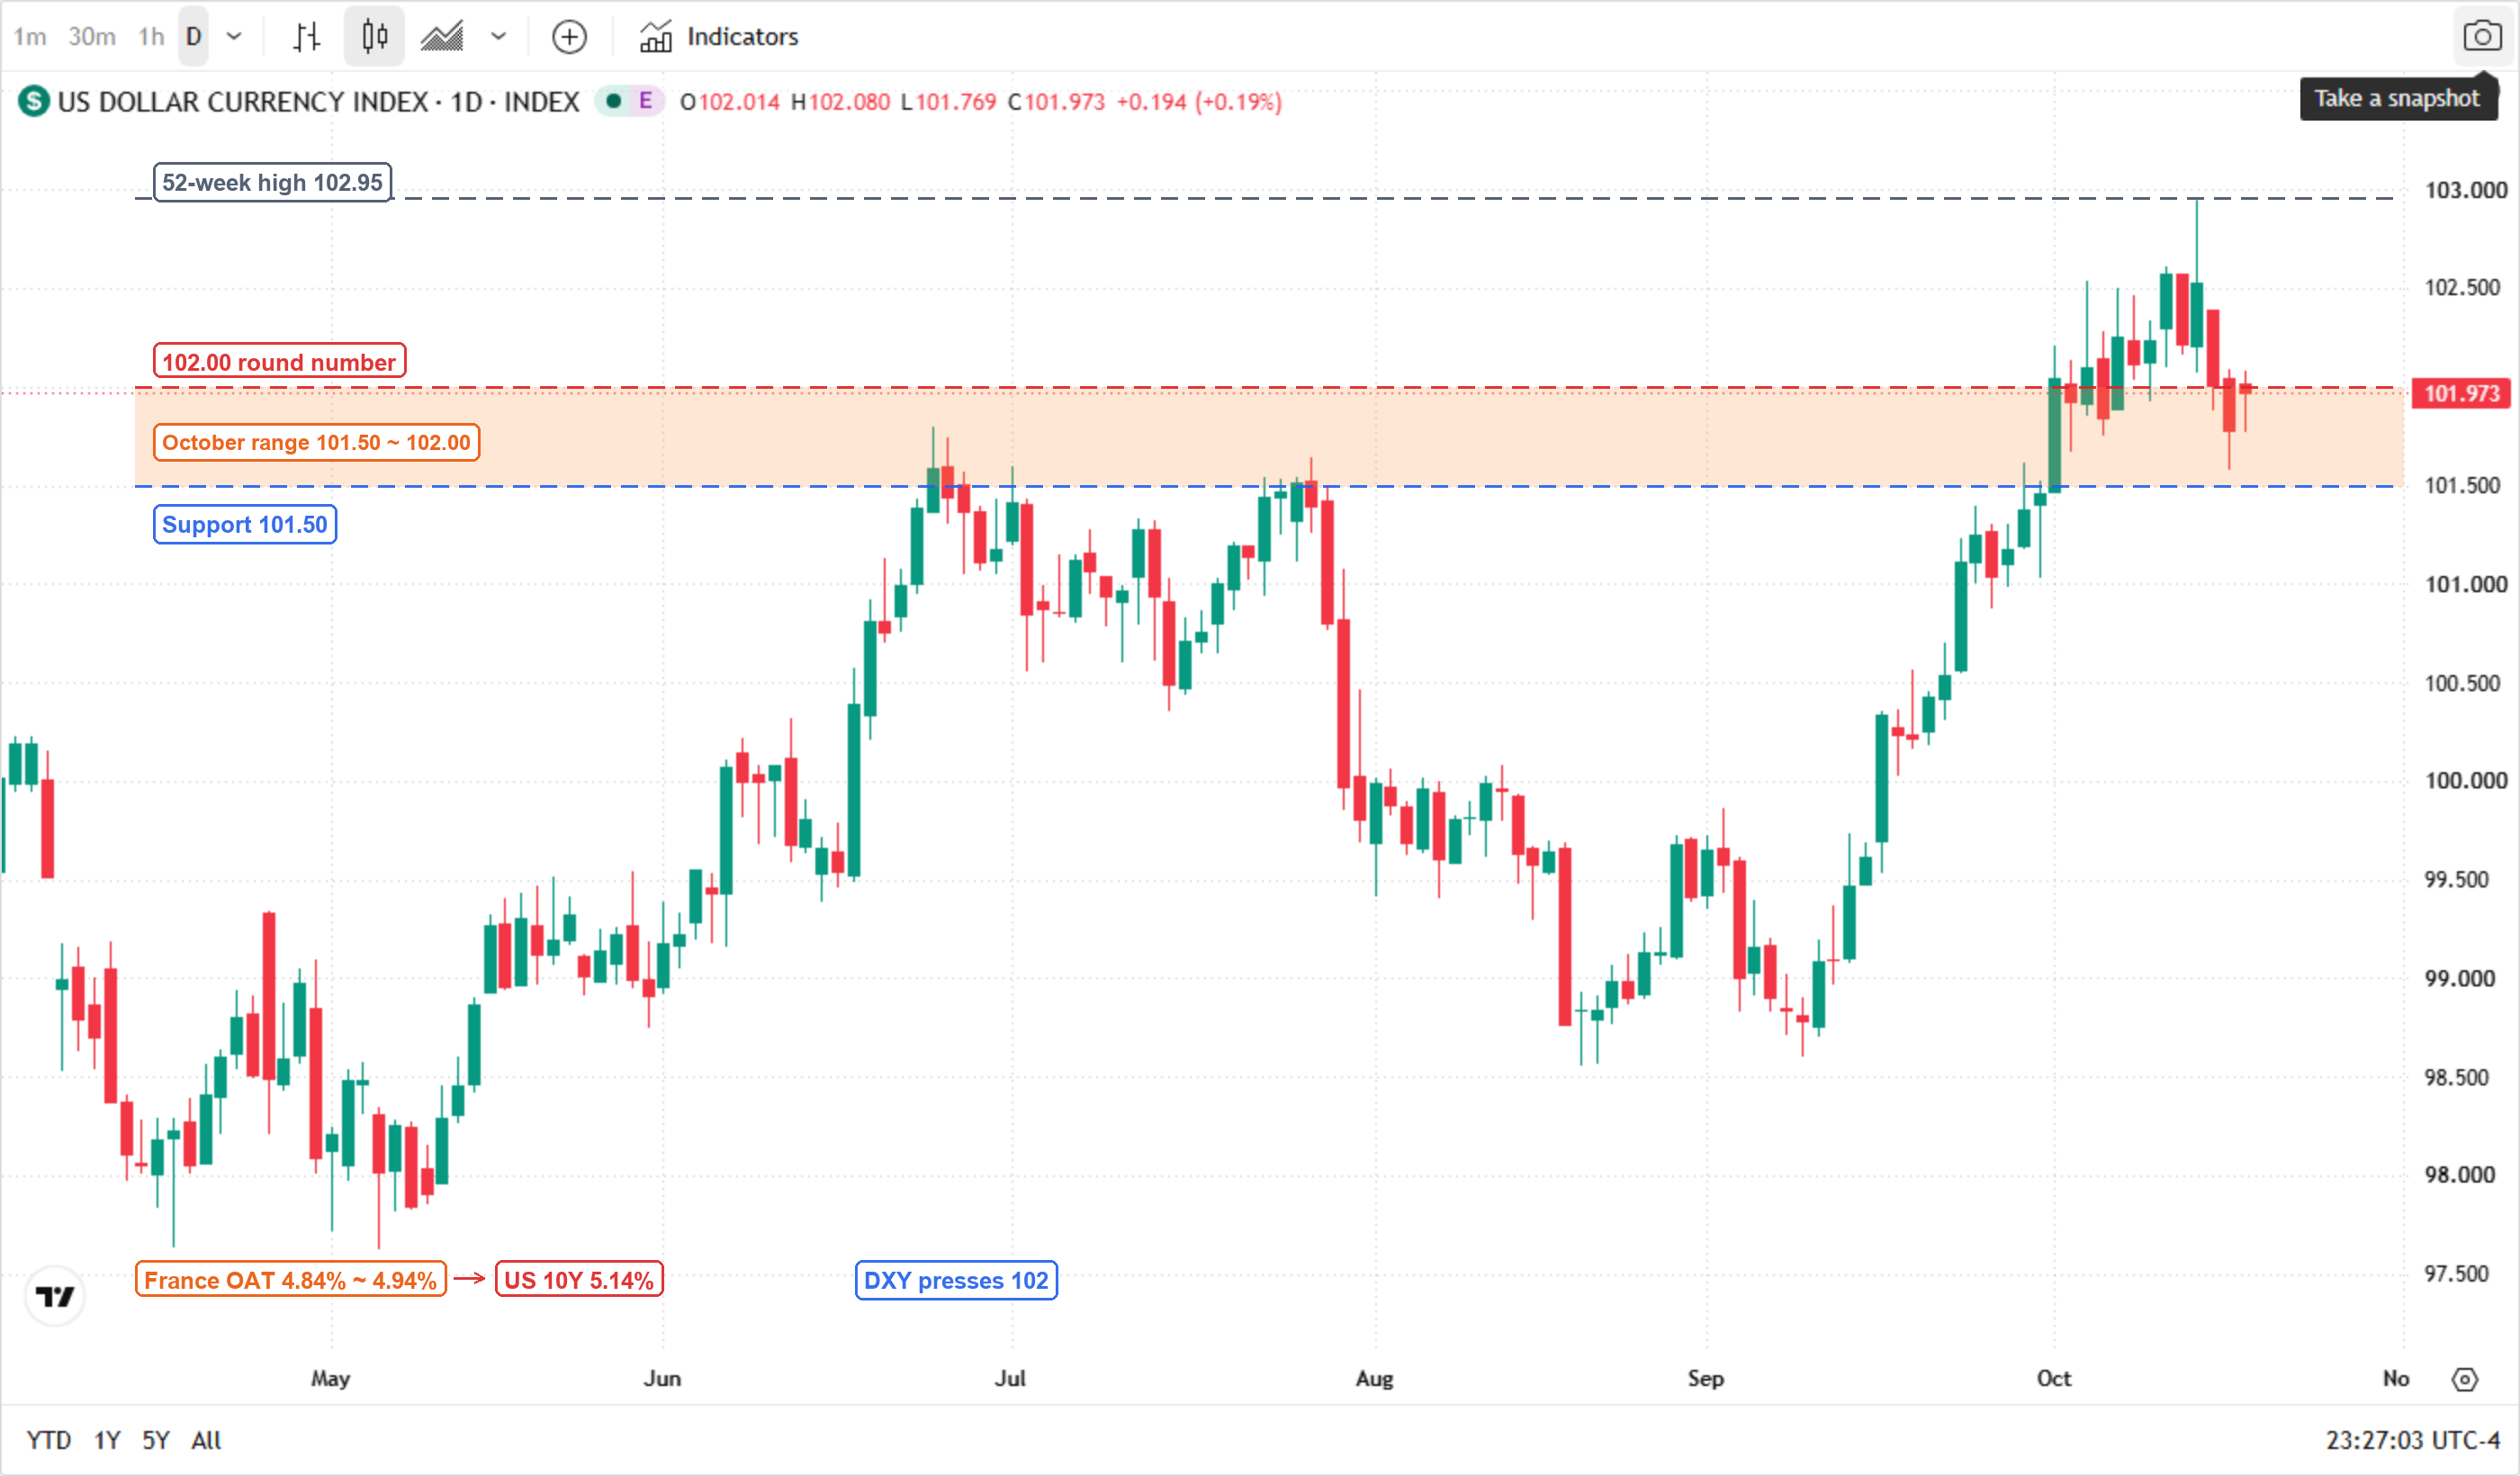
* Chart source: TradingView official chart screenshot, data source INDEX:DXY.
The structure to respect: a daily close above 102.00 keeps the uptrend intact and opens 102.55 and then 102.95. A failure back below 101.50 would shift the range lower, with 101.00 as the next support. The dollar is not overbought, but it is extended relative to its 50-day average near 100.39 and 200-day average near 99.49 — a pause would not break the trend.
6. What to watch: a three-part calendar
Today — Canada CPI and US housing data. Canada's September CPI is expected at 3.2% year on year; a hotter print would lift global yields and support the dollar, while a soft print would ease the term-premium pressure.
Tonight — Netflix earnings after the US close. The result matters for the AI/growth complex more than for the dollar, but a weak guide would reinforce the "higher rates, lower multiples" trade.
October 27-28 FOMC and October 29-30 BOJ. The Fed is priced at 17% for October and 90% for December; the BOJ is expected to hold at 1.25%, with a December hike to 1.5% still possible. A hawkish BOJ surprise would hit USD/JPY and drag the dollar index lower; a dovish hold would do the opposite.
The bottom line: the dollar's strength is being imported from the bond market, not exported by the Fed. That makes 102.00 the level to watch — and the October FOMC the event that decides whether the 17% probability was a warning or a footnote.
Read more
Before making any trading decisions, it is important to equip yourself with sufficient fundamental knowledge, have a comprehensive understanding of market trends, be aware of risks and hidden costs, carefully consider investment targets, level of experience, risk appetite, and seek professional advice if necessary.
Furthermore, the content of this article is solely the author's personal opinion and does not necessarily constitute investment advice. The content of this article is for reference purposes only, and readers should not use this article as a basis for any investment decisions.
Investors should not rely on this information as a substitute for independent judgment or make decisions solely based on this information. It does not constitute any trading activity and does not guarantee any profits in trading.
If you have any inquiries regarding the data, information, or content related to Mitrade in this article, please contact us via email: insights@mitrade.com. The Mitrade team will carefully review the content to continue improving the quality of the article.


