


Gold Price Analysis Today | Forex Gold Analysis | XAU/USD Analysis - October 29, 2026

Today's Gold Price
Gold price chart for today
*0% Commission and Low Spreads 0️⃣
*$50,000 in Free Virtual Funds 💰
*$100 New Customer Bonus 🎁
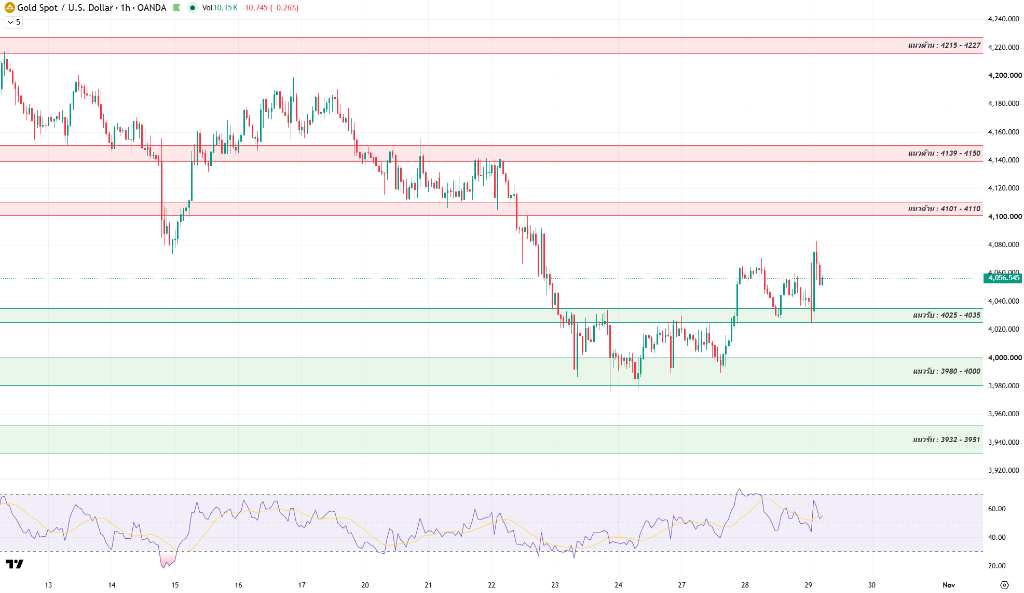
Gold (XAU/USD) recovered and held near $4,056 this morning (October 29, 2026) after pulling back to test the key $4,025–4,035 support base. The move followed the FOMC's expected decision to hold rates at 3.75%–4.00%, but the 10-2 vote surprised markets as two officials dissented in favor of an immediate rate hike, lifting the implied probability of a December rate increase to 83%. Tonight's U.S. third-quarter GDP estimate and Core PCE inflation data will determine whether gold can clear $4,101–4,110 resistance.
Today's Key Points
| Key Takeaways |
|
|
|
Fed Holds Rates at 3.75%–4.00% in 10-2 Vote; Two Officials Surprise With Calls for Immediate Hike
The FOMC voted 10-2 to hold the policy rate at 3.75%–4.00%, as expected, saying the economy was still expanding strongly, spending remained resilient and the labor market was stable. It nonetheless stressed that inflation remained elevated, so it needed to await more data to return inflation to its 2% target.
The surprise was the dissent from Lisa Cook and Beth Hammack, who favored an immediate 25-basis-point rate hike. Cook in particular had not dissented since taking office in 2022. The result led futures markets to raise the probability of a December rate increase to as high as 83%, underscoring that inflation pressures are still forcing the Fed to maintain a restrictive stance.
Gold Falls to $4,035 Before Rebounding as Analysts Say Fed Has Clearly Signaled Readiness for a Year-End Rate Hike
After the decision was released, spot gold fell to $4,035.48, down 0.60%, on concern over the opportunity cost of holding the metal. Technical buying then supported a rebound, with prices stabilizing near $4,056.80 late in U.S. trading. Silver fell 1.07% to $53.72, reflecting sensitivity to both funding costs and industrial demand.
Chris Zaccarelli of Northlight said the Fed had left a clear trail that it was ready to raise rates in December and likely would have done so already if not for the midterm elections. That aligns with Seema Shah of Principal Asset Management, who expects rate hikes in December and early 2027, which would continue to cap gold's upside.
Warsh Set to Restructure 2027 Meetings and Reduce Interest-Rate Voting Rounds as Middle East Energy Crisis Continues to Support Gold
Kevin Warsh outlined a plan to restructure meetings: there would be one meeting without an interest-rate vote in 2027, rising to two in 2028, reducing the number of annual rate-adjustment rounds to six. He also said investment in AI was helping to support economic growth significantly.
On the geopolitical front, the Houthis claimed to have fired missiles at the Ras Tanura refinery, keeping Brent crude above $115. Concern over the Strait of Hormuz continued to support safe-haven demand for gold, even though higher oil prices could accelerate inflation and leave room for the Fed to continue raising rates.



Technical Analysis of Gold (XAU/USD)
On the one-hour chart, gold has absorbed selling pressure well. After pulling back to test key $4,025–4,035 support, it rebounded to trade near $4,056.50. Candles are beginning to form higher lows, suggesting selling pressure is easing and institutional buying has returned to support prices.
The RSI has recovered to around 55–60 and is holding firmly above 50, indicating that buying momentum is regaining control and leaving room for a continuing short-term technical rebound.
The key test is a reclaim and break above the initial $4,101–4,110 resistance zone to confirm the recovery. Until then, beware of a bull trap that could draw in buyers before prices fall back to retest lower support.
Holding above $4,025–4,035 and clearing the first resistance zone would open the way toward $4,139–4,150 and $4,215–4,227. A break below $4,025, however, would open downside toward $3,980–4,000 and then $3,932–3,951.
Today's Gold Price Outlook
| Scenarios |
|
|
|
Today's Trading Strategy
Short-term traders should trade the range cautiously and avoid chasing prices into resistance. Wait for reversal candles and trading volume around support before opening positions for greater safety.
- Buy setup: Look for a pullback to $4,025–4,035 support with clear signs of buying support, or follow a break above $4,110. Targets are around $4,139–4,150, with a stop-loss below $4,020.
- Sell setup: Consider short positions if prices rebound to $4,101–4,110 or $4,139–4,150 resistance and fail to break through, or if they fall below $4,025. Targets are around $3,980–4,000, with a stop-loss above resistance.
For long-term investors, support from Middle East tensions and oil prices continues to underpin prices. Consider accumulating on pullbacks to the $3,980–4,000 or $3,932–3,951 support bases.
Daily Support and Resistance Levels
| Type | Price Level |
| Support #1 | $4,025–4,035 |
| Support #2 | $3,980–4,000 |
| Support #3 | $3,932–3,951 |
| Resistance #1 | $4,101–4,110 |
| Resistance #2 | $4,139–4,150 |
| Resistance #3 | $4,215–4,227 |
Today's Questions (FAQ)
Why Did Gold Pull Back to Test $4,035 Even Though the Fed Held Rates in a 10-2 Vote?
Although the Fed held rates as expected, the two officials who dissented in favor of an immediate 25-basis-point hike delivered a more hawkish-than-expected signal. Markets therefore saw a high probability of a December rate increase, raising the opportunity cost of holding gold and triggering short-term selling.
How Could the Fed's Plan to Reduce Interest-Rate Voting Rounds in 2027–2028 Affect the Gold Market?
Reducing the number of meetings that include interest-rate decisions to 6–7 per year would reduce opportunities to adjust policy. Investors would therefore need to manage gold-price volatility over longer intervals between decisions and rely more closely on economic data released between meetings to assess the rate outlook.
Read more
The above content was completed with the assistance of AI and has been reviewed by an editor.


