

Markets rarely behave in a clean, predictable way. One moment, momentum looks strong enough to continue for hours. The next moment, a sudden reversal wipes out direction and confidence at the same time.
It is usually not the market direction itself that causes problems, but the way traders react inside that movement.
And this is where tools like the Supertrend indicator quietly become relevant.
Today, we are going to look at the Supertrend indicator and understand how it works as well as how you can use it to improve your trading.
What Is the Supertrend Indicator?
The Supertrend indicator is a trend-following technical tool designed to simplify market direction into a clear visual structure.
Instead of analyzing dozens of signals, it reduces market behavior into a single dynamic line that flips between bullish and bearish conditions depending on price movement and volatility.
When price stays above the line, the market is generally considered to be in an uptrend. When price falls below it, the structure shifts into a downtrend.
On Mitrade trading platform, you can just select the “indicators" and add the Supertrend Indicator to your chart. For example,

( Supertrend Indicator, souce Mitrade platform)
Unlike predictive indicators, Supertrend does not attempt to forecast turning points. It reacts to price behavior and volatility, making it more of a market condition filter than a forecasting tool.
This is also why it is widely used across different markets, including forex, indices, and crypto assets such as Bitcoin, where trend clarity often matters more than precision entry timing.
How It Works?
At its core, Supertrend is built around volatility. Not price alone, but how aggressively price moves within a given period.
When volatility expands, the indicator adjusts its distance from price. When volatility contracts, it tightens closer. This dynamic behavior is what allows it to remain relevant in both calm and highly reactive markets.
Working with the indicator is quite simple since all you need to do is to look at it.
When loaded on a chart, it appears like the moving average indicator. However, unlike the MA, it changes color depending on the prevailing trend.
Below is a chart with the Supertrend indicator:

As you can see, the indicator is quite similar to the moving average. There are a few differences such as the distance from the price, the behavior when crossing over, and the change of color.
When you open the indicator’s properties, you will see two options:
● Super Trend ATR Period, and
● Super Trend Multiplier
Good for you if you know what the ATR is because you already have an idea of how this tool works.
ATR
The Average True Range, commonly known as the ATR, is an indicator used to measure the volatility of a market.
It takes into consideration the previous high and close of a specified period in its calculations.
So, when your ATR period in the Supertrend indicator is set at “14”, then it means the indicator is looking back at the highs and lows of 14 days.
That said, when a market is highly volatile, then the ATR will be high. On the other hand, if there is little volatility, then we ATR will be low.
Now, the Supertrend combines the ATR with a “multiplier” to detect the changes in trend direction.
The good thing is that you don’t have to memorize the complex formulas used in creating the indicator since it does all the work for you and displays either a red or green line.
Buy and Sell Signals
The Supertrend indicator is more of a lagging indicator as it depends on current price action to give signals. In short, it does not predict the future behavior of price. Rather, it shows you what is happening at the moment.
Using this indicator is quite simple:
→ When the color changes to red, then it is telling you to open a sell trade as the trend is currently down.
→ When the color turns to green (or lime), then it means you should open a buy trade since the trend is now going up
It is that simple!
Let me burst your bubble: in as much as the indicator seems too promising, it is not the holy grail of trading. There is none.
Once you load it to your chart, you will realize that there are times when it captures the trends very early. On the sadder side, sometimes, it gives you a signal when the trend has happened, so you miss the juiciest moves.
What this should tell you is that it is impossible to be profitable by following the Supertrend indicator blindly. In short, you should have a secondary means of filtering the signals so that you only pick the ones with high winning probabilities.
In the chart below, we are going to see what would happen if we took all the signals that the indicator gave us.
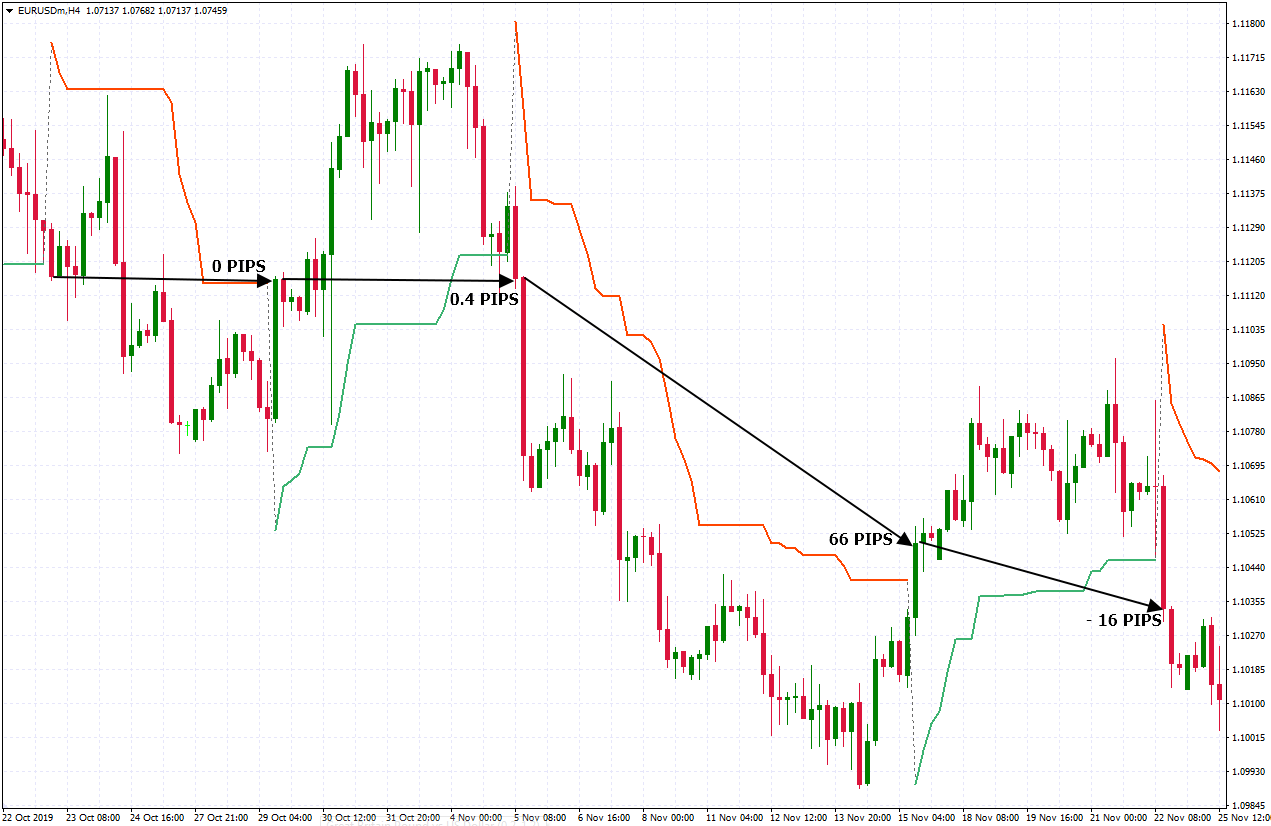
As you can see, the indicator was giving us good entry signals most of the time, but the exits somehow came late after we had lost most of the pips made.
For instance, even in places where we ended up with 0 pips in profit, the market had given us tens or even thousands of pips before reversing and closing.
Bearing in mind that the above chart covers two months, making 66 pips and losing another 16 means we would have made 50 pips.
While this is still better than making a losing trade, it is still painful to have lost hundreds of other pips.
Therefore, while the Supertrend indicator is a good tool, it is not commendable to use it on its own.
Best Settings to Use
Just like any other indicator, the Supertrend has no fixed or definite setting that works for everyone all the time.
I would say the setting you choose is up to you.
Typically, the indicator has a default setting of 10 ATR period and 3.0 Multiplier.
If you reduce the settings too much, then the indicator will give a lot of signals, in which most of them will be false.
Similarly, if you raise the numbers too high, the indicator will give fewer signals, meaning you might lose a lot of good trading opportunities.
As such, start trying the indicator with its default settings and play around with them until you find the best ones that work for you.
Best Timeframe for Supertrend Strategy
Timeframe selection has a direct impact on signal quality.
On lower timeframes like M5 or M15, Supertrend tends to generate frequent flips. Some of these reflect real movement, but many are noise-driven reactions to micro volatility.
On higher timeframes such as H1 and above, signals become less frequent but more structurally meaningful.
For this reason, many traders avoid using Supertrend below the 15-minute chart, especially in volatile assets like crypto, where price movement can be abrupt and short-lived.
A more balanced approach is often multi-timeframe analysis—using a higher timeframe for direction and a lower timeframe for entries.
Where to Find It?
Some trading platforms such as the MT5 have the Supertrend included in the in-built indicators section.
For others, such as the older MT4, the indicator is not included in the program when installing it, not unless your broker has included it.
If your trading platform does not have it, you can download the indicator online and include it.
Mitrade platform provide free technical indicators, including Supertrend and more. Just try to open a demo account to practice trading. You will find how it simple to use the supertrend indicator. Open demo account>>
Sample Strategy using the Supertrend Indicator
Always remember that indicators should never be used as the ultimate trading decision-makers. Only use them to assist you in spotting potential opportunities or confirming signals that you have identified using your primary way of analysis.
That said; this tool can be combined with almost any other trading approach.
In this section, we are going to look at a trading strategy that uses two settings of our Supertrend indicator.
Load the Supertrend tool into your chart
Leave the settings at default (10, 3). This indicator will be giving us the entries.
Load the Supertrend indicator again
This time, set the period to 32 and the multiplier to 9. You can change the color or width of this bigger indicator so that you can tell them apart. This instance of the indicator will be giving us the main trend direction.
Below is a chart with this setup:
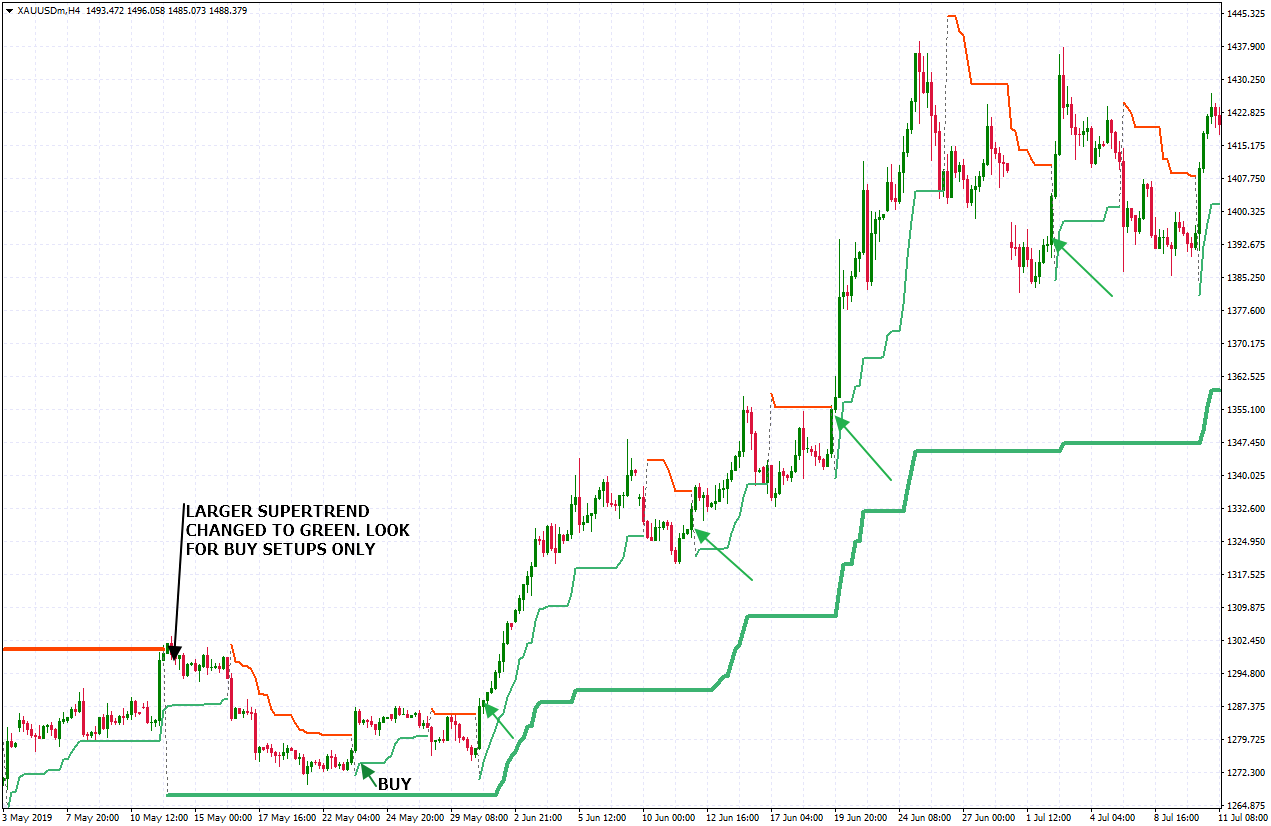
To trade with this strategy:
Wait for the main (bigger) Supertrend version to change from red to green or green to red. In our case above, we had it changing from red to green.
If it changes from green to red, wait for the smaller Supertrend version to turn red. Then open a sell trade. In our chart, we were expecting a buy trade. So, when the smaller Supertrend turned to green, we opened a buy trade.
In case you miss the first entry, you can wait for other opportunities using the smaller Supertrend since it will keep changing color as the trend continues.
Place your stop loss on the previous low.
You can hold the trades until the price comes back and touches or crosses the main Supertrend.
Final Thoughts
The Supertrend indicator is a simple, easy-to-use but a very effective volatility-based trading tool.
It follows the trend direction of the price and gives early entry and/or exit signals. If used properly, it can become a trader’s valuable tool for making decent income off online trading including forex, stocks, indices, and so on.
The trader should practice with the indicator until they get the best setting and timeframe to apply.
If coupled with proper discipline and risk management, the Supertrend indicator can turn a losing trader into a consistent winner without the need for tons of mind-boggling calculations and methods.
* The content presented above, whether from a third party or not, is considered as general advice only. This article should not be construed as containing investment advice, investment recommendations, an offer of or solicitation for any transactions in financial instruments.


