


Tesla jumps 5% as Barclays puts a $450 target on the SpaceX merger — the chart was already pointing to 431


Mitrade Insights — Tesla closed at $391.62 on October 26, up 5.21%, after Barclays upgraded the stock to Overweight from Equal Weight and lifted its 12-month price target to $450 from $370. The note cites a “sharp inflection” in Robotaxi miles, FSD penetration above 75% of newly purchased North American Teslas in Q3, an energy business that is “nearly sold out” for 2027, and a potential SpaceX merger as “a key part of the Tesla bull case.” The stock is now above a neckline that had capped it since early October. The question is whether this is an analyst story or a chart story — the answer is both.
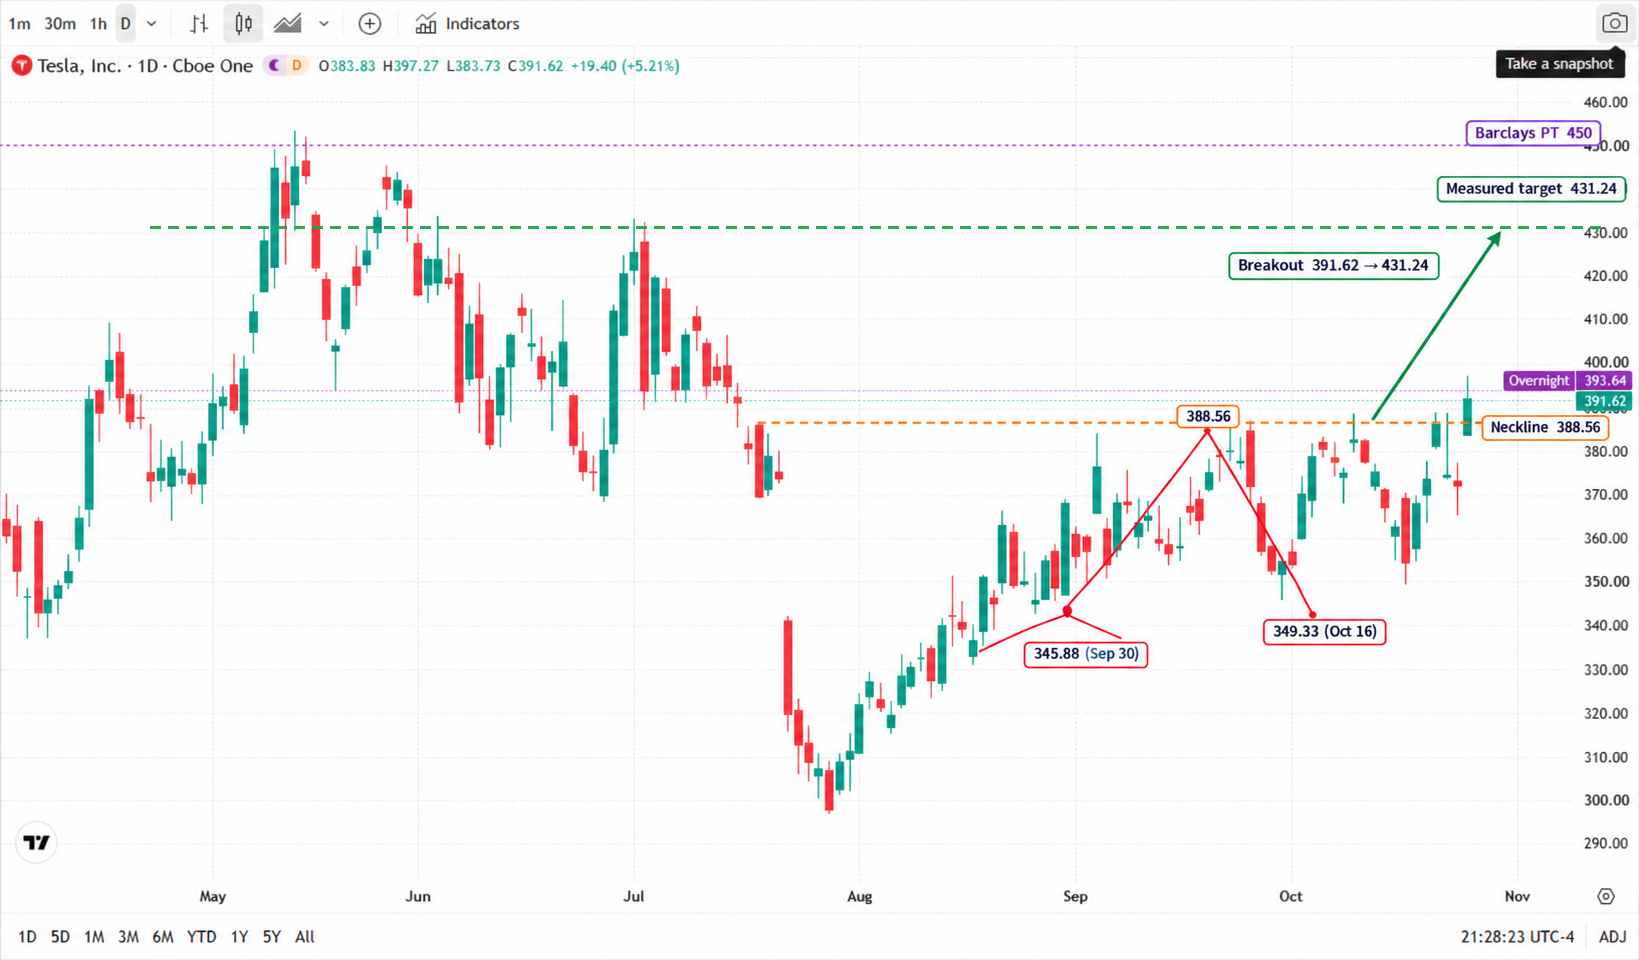
* Chart source: TradingView official chart screenshot, data from Cboe One (TSLA).
The 5% move started at $349.33, not at the upgrade
The double bottom Barclays walked into
The chart did not wait for Barclays. Tesla made its first low at $345.88 on September 30, rallied to $388.56 on October 9, then made a second low at $349.33 on October 16 — a 0.99% difference between the two lows, well inside the 1.5% tolerance that defines a valid double bottom. The neckline is $388.56. The measured target is $431.24 — the height of the pattern (388.56 − 345.88 = 42.68) added to the neckline.
Monday's close of $391.62 put the stock 0.8% above the neckline. That is not a decisive breakout yet, but it is the first close above the line since the pattern formed. The pattern is not about moving averages; the story is that the two lows were almost identical, the rally between them was clean, and the breakout came on a fundamental catalyst.
Why $388.56 was the line
$388.56 is not a round number, which is why it matters. It is the October 9 high — the point where sellers refused to pay more before the second leg down. A close above it means the people who sold the first rally have been absorbed. The next resistance is the June high around $433.60; above that sits the May high of $453.40. The measured target of $431.24 sits just below the June high, which is why it is a reasonable first objective rather than a final one.
The SpaceX merger is now part of the bull case
Barclays' Dan Levy did not just raise the target; he changed the framework. The note says Tesla and SpaceX have formed committees to explore a combination, and calls a deal “a key part of the Tesla bull case” because it could deliver a takeover premium. There is no agreement yet, and any deal would need shareholder approval, so this is a call option on a merger — not a completed transaction.
The rest of the upgrade is more mundane but more important for the next quarter. Robotaxi miles have inflected sharply in recent weeks, after a slow ramp since the June 2025 launch. FSD adoption exceeded 75% of newly purchased North American Teslas in Q3. The energy business is “nearly sold out” for 2027, with Barclays expecting shipment growth above 50%. The auto business is expected to return to growth in 2026 after two years of declines.
| Barclays upgrade | Before | After |
|---|---|---|
| Rating | Equal Weight | Overweight |
| 12-month target | $370 | $450 (+21.6%) |
| Robotaxi | Slow ramp | “Sharp inflection” in miles driven |
| FSD penetration | — | >75% of new North American Teslas in Q3 |
| Energy business | — | “Nearly sold out” for 2027, >50% shipment growth |
| SpaceX merger | Not in the thesis | “Key part of the bull case” |
What would break the 431 target
The bull case has three assumptions: Robotaxi miles keep accelerating, the energy business grows above 50%, and the SpaceX merger talks move toward a real agreement. The first two are already in the numbers; the third is not. If the merger talks stall, the stock can still hold the neckline on the operating story, but the $450 target loses its premium component and the $431.24 measured target becomes the realistic ceiling.
The bear case is simpler: Monday's move was a 5.21% single-day re-rating on an analyst note, not on a company beat. Tesla's six-month high is $453.40, and the stock is still 13.6% below it. A failure back below $388.56 would invalidate the breakout and put $349.33 back in play. The chart's trigger is one line: hold $388.56, and the measured target is $431.24; lose it, and the double bottom becomes a failed pattern.
Read more
Before making any trading decisions, it is important to equip yourself with sufficient fundamental knowledge, have a comprehensive understanding of market trends, be aware of risks and hidden costs, carefully consider investment targets, level of experience, risk appetite, and seek professional advice if necessary.
Furthermore, the content of this article is solely the author's personal opinion and does not necessarily constitute investment advice. The content of this article is for reference purposes only, and readers should not use this article as a basis for any investment decisions.
Investors should not rely on this information as a substitute for independent judgment or make decisions solely based on this information. It does not constitute any trading activity and does not guarantee any profits in trading.
If you have any inquiries regarding the data, information, or content related to Mitrade in this article, please contact us via email: insights@mitrade.com. The Mitrade team will carefully review the content to continue improving the quality of the article.


