

Top Altcoins Price Forecast: Ripple and Solana under pressure as Hyperliquid recovers

Source Fxstreet
  • Ripple is down over 2% on Thursday, extending losses below $1.30 and capped below crucial moving averages.
  • Solana drops 2% so far, testing its 200-day EMA and the $100 psychological level amid mounting selling pressure.
  • Hyperliquid is up 7%, reclaiming its 50-day EMA at $81.21, suggesting renewed bullish momentum.

Institutional demand shakes

Institutional demand for altcoins is weak in the near term. Solana-focused ETFs record $5.66 million in outflows on Wednesday, after over $19 million and $8 million in outflows earlier this week, bringing the total to $33.04 million. A negative close to this week would mark its fourth consecutive weekly outflow, suggesting intense selling pressure from institutional investors.

Meanwhile, XRP and HYPE are facing institutional silence, with zero inflows on Wednesday, with weekly outflows of $3.61 million and $4.30 million, respectively.
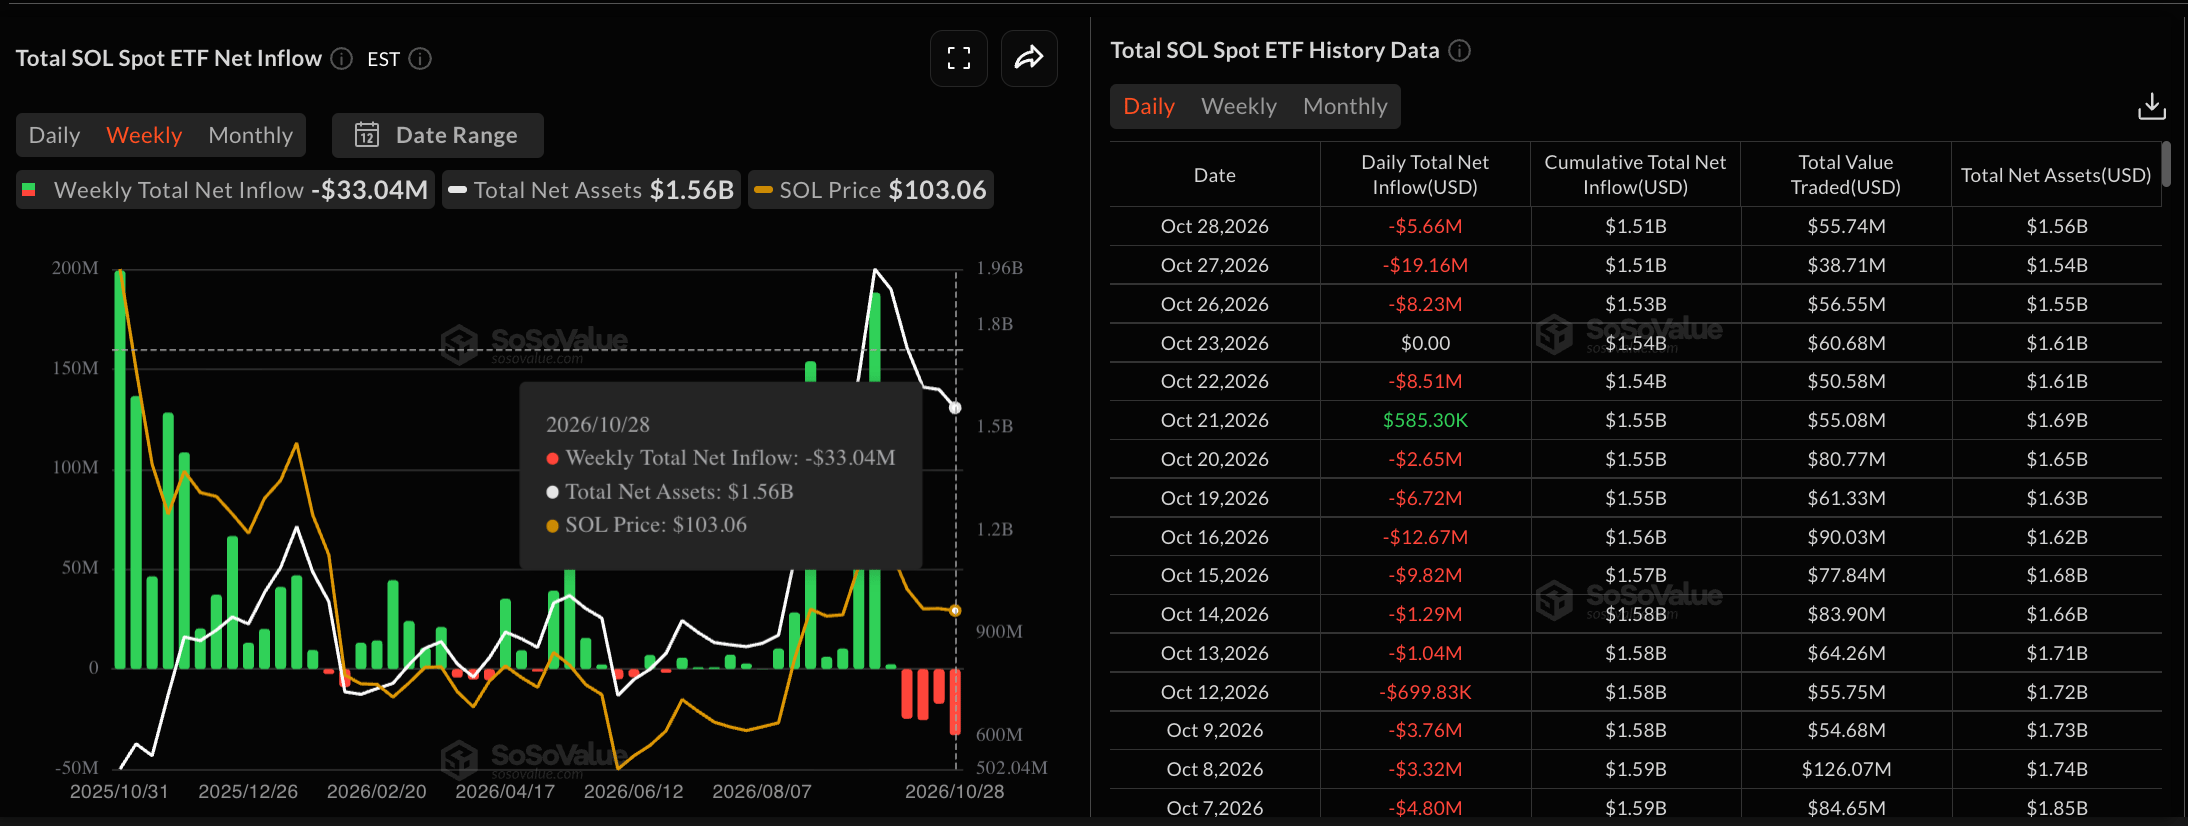

SOL ETFs data. Source: Sosovalue
XRP and HYPE ETFs data. Source: SoSoValue

Ripple risks breaking the key support floor

Ripple trades at $1.2924 at press time on Thursday, keeping a bearish near-term tone. XRP sits well below the 50-day and 200-day Exponential Moving Averages (EMAs) at $1.3574 and $1.3891, respectively.

The price has also retreated beneath the downward trendline barrier at $1.3216, suggesting that recent attempts to reclaim the resistance have failed.

Momentum is weak rather than washed out, with the Relative Strength Index (RSI) hovering near 40 on the daily chart, while the Moving Average Convergence Divergence (MACD) is flat in negative territory, hinting that any recovery could remain constrained.

A confirmed breakout below the $1.2588 level, set by the August 21 low, could extend the decline toward the August 2 high around $1.0933.

Chart Analysis XRP/USDT (Binance)
XRP/USDT daily price chart.

On the topside, initial resistance appears at the trendline break zone around $1.3216, followed by the 50-day EMA at $1.3574 and the denser structural cap provided by the 200-day EMA at $1.3891.

Solana tests the 200-day EMA support

Solana hovers around $100 on Thursday, keeping a bearish near-term bias. The SOL price remains below the 50-day EMA at $105 while holding above the longer-term 200-day EMA at $98.36.

The RSI around 35 hovers just above oversold territory, and the MACD stays negative, together suggesting waning but still dominant downside momentum.

A sustained close below the 200-day EMA at $98.36 could result in another test of the rising support trendline near $87.26.
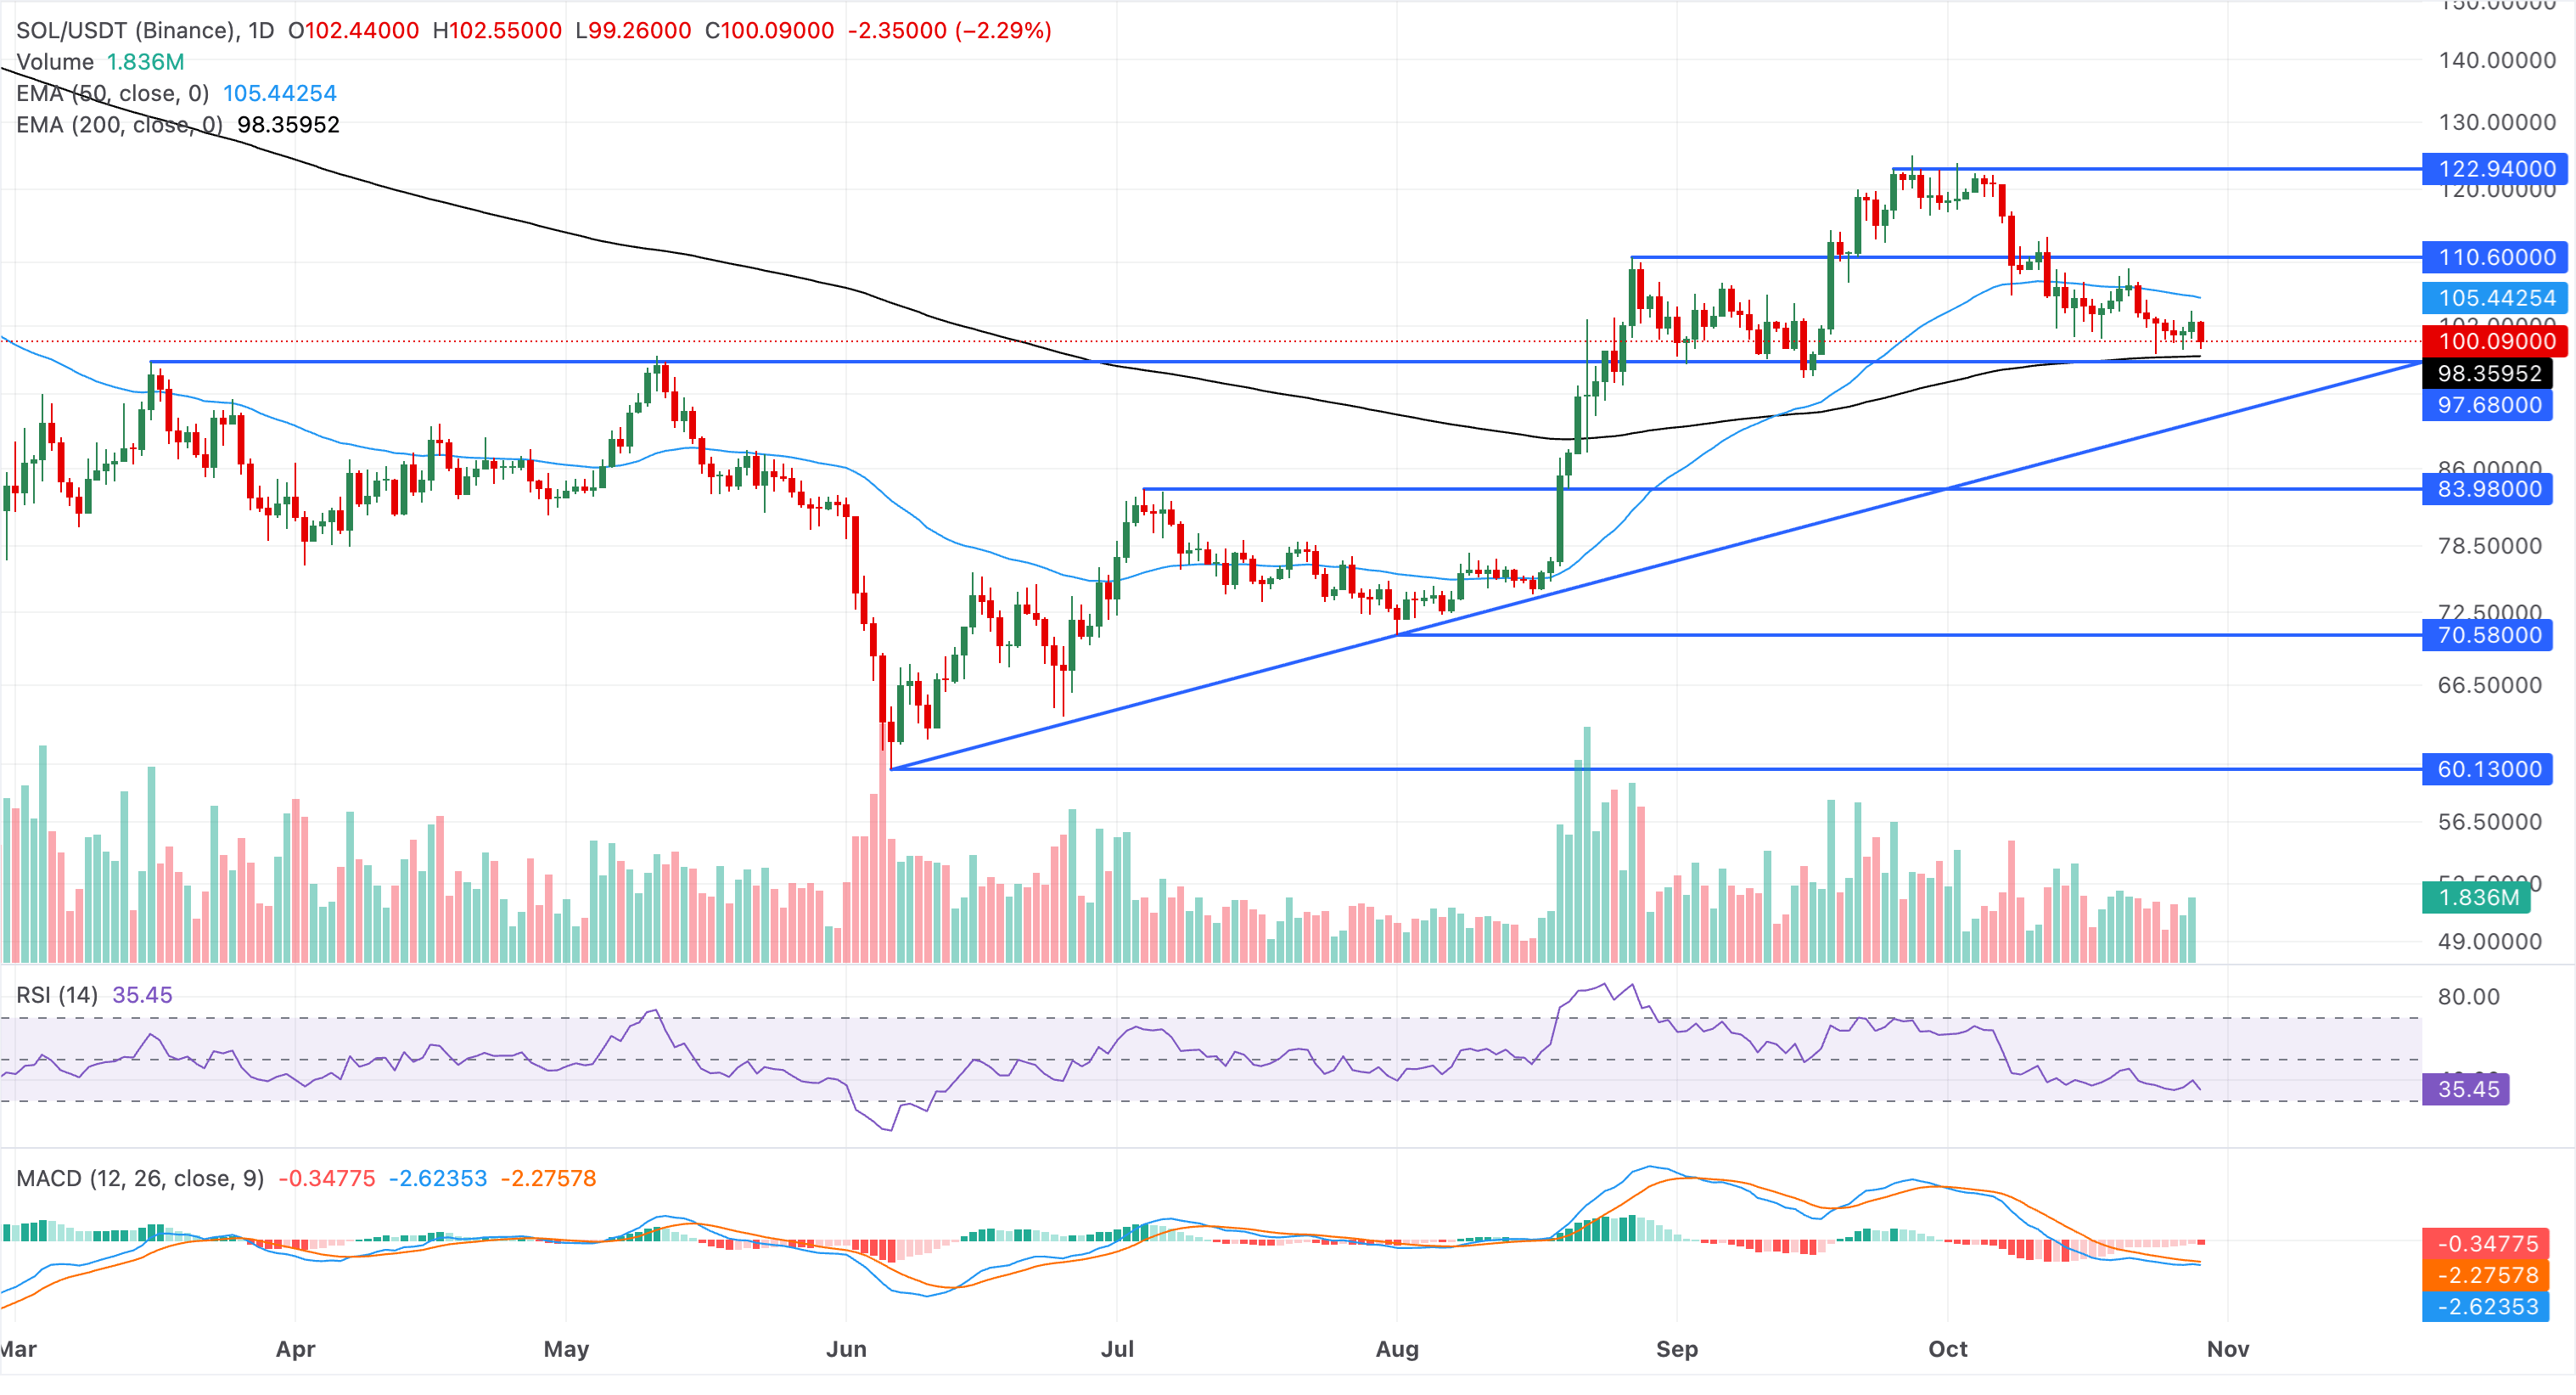
SOL/USDT daily price chart.

Immediate resistance is located at the 50-day EMA near $105.44, which caps recovery attempts and would need to be reclaimed to open a more constructive bullish phase.

Hyperliquid capped below 50-day EMA

Hyperliquid hovers above $86.00 on Thursday, maintaining a bullish near-term bias. HYPE holds well above the 50-day EMA at $81.82 and the 200-day EMA at $67.77, keeping the broader uptrend intact despite recent volatility.

Momentum conditions are constructive, with the RSI near 59 and the MACD in positive territory, hinting that buyers remain in control.

The immediate resistance for HYPE aligns with the September 3 high around $88.14, which could open the path toward the September 23 high around $98.30 and the $100 psychological threshold.

Chart Analysis HYPE/USD (baha Crypto)
HYPE/USD daily price chart.

On the downside, immediate support is defined by the 50-day EMA near $81.82. Below that, the longer-term bullish structure is supported by the rising trendline around $76.07 and the 200-day EMA at $67.77, with deeper pullbacks expected to attract dip-buying interest.

(The technical analysis of this story was written with the help of an AI tool. Know more.)

Disclaimer: For information purposes only. Past performance is not indicative of future results.
placeholder
Big Tech's $800 billion AI bill faces its first real test — free cash flow is the judgeAlphabet and Microsoft report after the close on October 28, Amazon on October 29, with hyperscaler AI capex running near $800 billion a year. Meta's negative free cash flow and 9.40% drop on October 22 was the warning; this week's prints decide whether cloud growth and backlog can pay for the buildout. Here are the consensus numbers, the free-cash-flow table and the two-sided test.
Author  Irene Q.
Oct 26, Mon
Alphabet and Microsoft report after the close on October 28, Amazon on October 29, with hyperscaler AI capex running near $800 billion a year. Meta's negative free cash flow and 9.40% drop on October 22 was the warning; this week's prints decide whether cloud growth and backlog can pay for the buildout. Here are the consensus numbers, the free-cash-flow table and the two-sided test.
placeholder
Anthropic files for a $2 trillion IPO — the $80.7 billion loss is the decoy, the $450 billion compute bill is the riskAnthropic publicly filed its S-1 on October 26, revealing $16.29 billion of first-half revenue (+1,304% year over year) and a $80.7 billion net loss — of which $72.4 billion is a non-cash convertible-note charge. The real number is the $450 billion of signed, mostly non-cancelable compute commitments. Here is what the filing says, why NVDA, ARM and MU are the tradeable read-through, and the conditions that decide whether the AI trade passes its first public valuation test.
Author  Irene Q.
Oct 27, Tue
Anthropic publicly filed its S-1 on October 26, revealing $16.29 billion of first-half revenue (+1,304% year over year) and a $80.7 billion net loss — of which $72.4 billion is a non-cash convertible-note charge. The real number is the $450 billion of signed, mostly non-cancelable compute commitments. Here is what the filing says, why NVDA, ARM and MU are the tradeable read-through, and the conditions that decide whether the AI trade passes its first public valuation test.
placeholder
Fed October Rate Decision Preview: Rate Hike Pause Has Become Consensus, How Will US Stocks, Dollar, and Gold React?The Federal Reserve will announce its October interest rate decision at 14:00 Eastern Time on October 28, and Fed Chair Warsh will hold a press conference at 14:30. Markets currently wide
Author  TradingKey
Oct 27, Tue
The Federal Reserve will announce its October interest rate decision at 14:00 Eastern Time on October 28, and Fed Chair Warsh will hold a press conference at 14:30. Markets currently wide
placeholder
Brent's $115 front month sits $4.6 above January — the $14 spread to WTI is the supply-risk premiumDecember Brent trades at $115.29 while January is $110.71, a $4.58 backwardation. The December Brent-WTI spread is $14.2, versus a $3-5 normal. That gap, not the headline, is where the Middle East supply risk is priced. Here is what the curve says, why the December contract's expiry on October 30 will mechanically cut the headline by $4.6, and the 108.81 neckline that decides the next move.
Author  Irene Q.
Yesterday 06: 21
December Brent trades at $115.29 while January is $110.71, a $4.58 backwardation. The December Brent-WTI spread is $14.2, versus a $3-5 normal. That gap, not the headline, is where the Middle East supply risk is priced. Here is what the curve says, why the December contract's expiry on October 30 will mechanically cut the headline by $4.6, and the 108.81 neckline that decides the next move.
placeholder
Gold Price Analysis Today | Forex Gold Analysis | XAU/USD Analysis - October 29, 2026Get the latest gold price analysis, forex gold insights, and XAU/USD analysis for October 29, 2026. Read on for the details.
Author  Mitrade
11 hours ago
Get the latest gold price analysis, forex gold insights, and XAU/USD analysis for October 29, 2026. Read on for the details.
goTop
quote