

Ethereum (ETHUSD) Is down 1.14% on Oct 29: Here Is Why

Source Tradingkey

Ethereum (ETHUSD) is down 1.14% at Oct 29 21:40(ET), now at $2331.45, with a 7-day down of 2.06%.
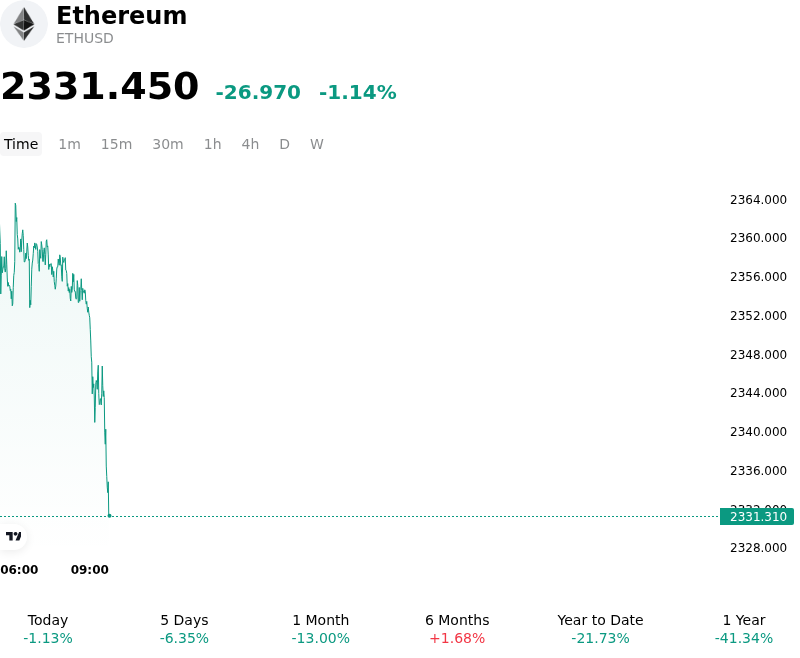
SummaryOverview

What is driving Ethereum (ETHUSD)’s stock price down today?

The downside movement in Ethereum reflects persistent headwinds from tight global liquidity conditions and an unfavorable interest rate environment following the Federal Reserve's recent monetary policy stance. With benchmark interest rates held in an elevated target range and hawkish dissents signaling potential further tightening, elevated U.S. Treasury yields continue to curb institutional risk appetite across digital assets. For Ethereum specifically, the current yield backdrop creates structural pressure, as its annualized staking yield trails prevailing dollar risk-free rates. This yield gap reduces the relative incentive for institutional investors to hold or stake Ether when competing money-market instruments offer higher guaranteed returns without price volatility.

Institutional flow dynamics have further exacerbated market pressure, driven by extended net outflows from U.S. spot Ethereum exchange-traded funds. Capital withdrawals across major spot ETH products have accumulated significantly throughout October, signaling a shift in institutional positioning toward capital preservation and selective rotation into major crypto benchmarks. The persistent redemptions from spot funds directly impact spot market liquidity, restricting organic buying power and leaving price action vulnerable to localized selling volume.

Ecosystem-specific catalysts have also failed to provide near-term momentum following the announced delay of the protocol's upcoming Glamsterdam network upgrade. Technical complications during testnet evaluations postponed key execution-layer and consensus optimizations, removing a major fundamental catalyst that investors had anticipated would enhance network throughput and transaction fee mechanisms. In the derivatives market, the absence of strong upside momentum triggered long liquidations as price action tested critical technical support zones, while recent on-chain whale distributions further weighed on short-term market sentiment.

Technical Analysis of Ethereum (ETHUSD)

Technically, Ethereum (ETHUSD) shows a MACD (12,26,9) value of -10.180, indicating a sell signal. The RSI at 39.453 suggests neutral condition and the Williams %R at 78.241 suggests sell condition. Please monitor closely.
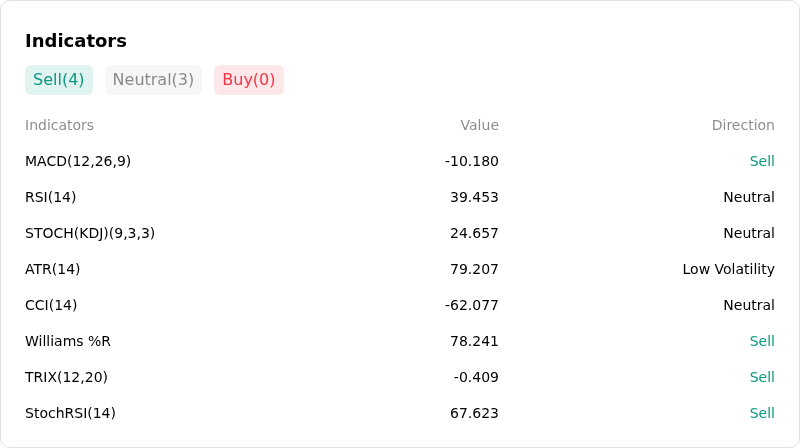
IndicatorAnalysis

More details about Ethereum (ETHUSD)

Recent Events and Risks:

  • Institutional Spot ETF Outflows: U.S. spot Ethereum ETFs recorded over $1.26 billion in net monthly redemptions, with ongoing daily outflows exceeding $60 million stripping away key institutional spot demand and compounding selling pressure across exchanges.
  • Concentrated Long Liquidation Risk: Elevated leverage across derivative venues has exposed significant structural downside fragility, with market data indicating up to $676 million in long positions subject to forced liquidations if ETH breaks below key support at $2,286, alongside major whale positions facing liquidation thresholds near $2,180.
  • Protocol Upgrade Delay: Core developers postponed the testnet deployment of the Glamsterdam upgrade following security concerns surrounding gas-pricing proposals EIP-8037 and EIP-8038, depriving Ethereum of a key near-term fundamental catalyst.
  • Technical Overhead Resistance and Weak On-Chain Activity: Rejection below important technical clusters—such as the 50-day and 100-day exponential moving averages between $2,362 and $2,450—coupled with declining daily active network addresses, keeps ETH vulnerable to a breakdown toward lower support floors near $2,200.
Disclaimer: For information purposes only. Past performance is not indicative of future results.
placeholder
Big Tech's $800 billion AI bill faces its first real test — free cash flow is the judgeAlphabet and Microsoft report after the close on October 28, Amazon on October 29, with hyperscaler AI capex running near $800 billion a year. Meta's negative free cash flow and 9.40% drop on October 22 was the warning; this week's prints decide whether cloud growth and backlog can pay for the buildout. Here are the consensus numbers, the free-cash-flow table and the two-sided test.
Author  Irene Q.
Oct 26, Mon
Alphabet and Microsoft report after the close on October 28, Amazon on October 29, with hyperscaler AI capex running near $800 billion a year. Meta's negative free cash flow and 9.40% drop on October 22 was the warning; this week's prints decide whether cloud growth and backlog can pay for the buildout. Here are the consensus numbers, the free-cash-flow table and the two-sided test.
placeholder
Anthropic files for a $2 trillion IPO — the $80.7 billion loss is the decoy, the $450 billion compute bill is the riskAnthropic publicly filed its S-1 on October 26, revealing $16.29 billion of first-half revenue (+1,304% year over year) and a $80.7 billion net loss — of which $72.4 billion is a non-cash convertible-note charge. The real number is the $450 billion of signed, mostly non-cancelable compute commitments. Here is what the filing says, why NVDA, ARM and MU are the tradeable read-through, and the conditions that decide whether the AI trade passes its first public valuation test.
Author  Irene Q.
Oct 27, Tue
Anthropic publicly filed its S-1 on October 26, revealing $16.29 billion of first-half revenue (+1,304% year over year) and a $80.7 billion net loss — of which $72.4 billion is a non-cash convertible-note charge. The real number is the $450 billion of signed, mostly non-cancelable compute commitments. Here is what the filing says, why NVDA, ARM and MU are the tradeable read-through, and the conditions that decide whether the AI trade passes its first public valuation test.
placeholder
Fed October Rate Decision Preview: Rate Hike Pause Has Become Consensus, How Will US Stocks, Dollar, and Gold React?The Federal Reserve will announce its October interest rate decision at 14:00 Eastern Time on October 28, and Fed Chair Warsh will hold a press conference at 14:30. Markets currently wide
Author  TradingKey
Oct 27, Tue
The Federal Reserve will announce its October interest rate decision at 14:00 Eastern Time on October 28, and Fed Chair Warsh will hold a press conference at 14:30. Markets currently wide
placeholder
Brent's $115 front month sits $4.6 above January — the $14 spread to WTI is the supply-risk premiumDecember Brent trades at $115.29 while January is $110.71, a $4.58 backwardation. The December Brent-WTI spread is $14.2, versus a $3-5 normal. That gap, not the headline, is where the Middle East supply risk is priced. Here is what the curve says, why the December contract's expiry on October 30 will mechanically cut the headline by $4.6, and the 108.81 neckline that decides the next move.
Author  Irene Q.
Yesterday 06: 21
December Brent trades at $115.29 while January is $110.71, a $4.58 backwardation. The December Brent-WTI spread is $14.2, versus a $3-5 normal. That gap, not the headline, is where the Middle East supply risk is priced. Here is what the curve says, why the December contract's expiry on October 30 will mechanically cut the headline by $4.6, and the 108.81 neckline that decides the next move.
placeholder
Gold Price Analysis Today | Forex Gold Analysis | XAU/USD Analysis - October 29, 2026Get the latest gold price analysis, forex gold insights, and XAU/USD analysis for October 29, 2026. Read on for the details.
Author  Mitrade
6 hours ago
Get the latest gold price analysis, forex gold insights, and XAU/USD analysis for October 29, 2026. Read on for the details.
goTop
quote