




NVIDIA Mirrors Bitcoin Setup as Trump’s Tariff Refunds Hit


NVIDIA Corporation (NVDA) stock price tests $201.75 resistance after a near 23% rally from its March 30 low at $164.04. NVDA trades at $199.24, down 1.21%, inside a bull flag handle that mirrors Bitcoin’s structure.
A US Supreme Court ruling on tariffs unlocks cost relief for NVIDIA’s import chain. And the next 1.5% of price action decides whether the 23% pole projection activates.
NVIDIA Stock Runs Bitcoin’s Playbook at Matched Volatility
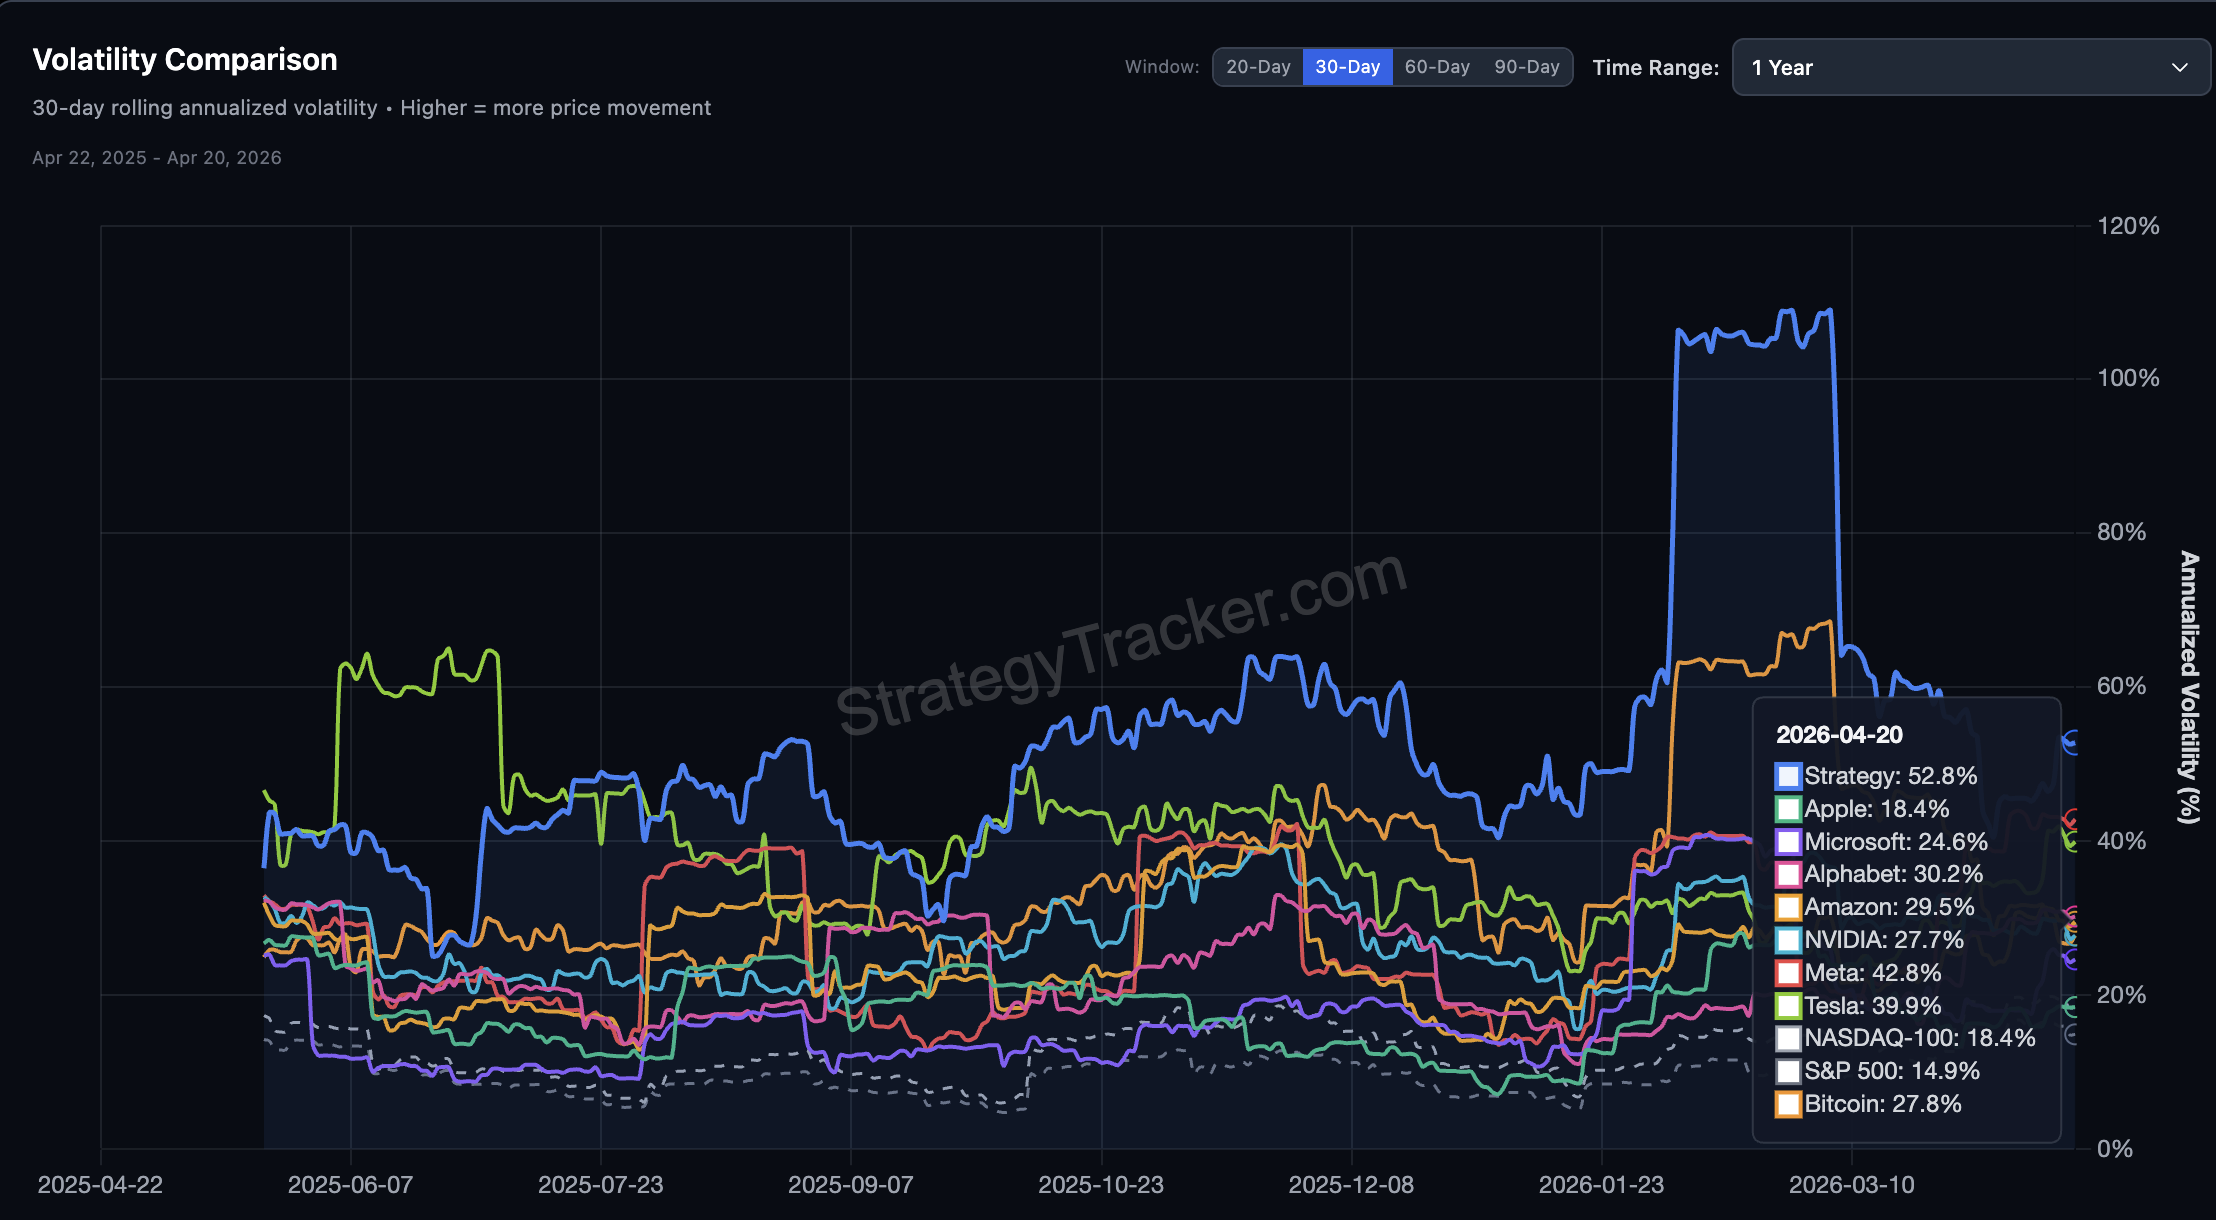
NVIDIA volatility, measured as the 30-day rolling annualized reading, sits at 27.7%. Bitcoin (BTC) prints 27.8% on the same screen. The gap is 10 basis points.
The S&P 500 reads 14.9%, NASDAQ-100 18.4%, Apple 18.4%, and Microsoft 24.6%. NVDA trades roughly 1.5 times its parent index and closely matches a crypto asset. Only MicroStrategy (52.8%), Meta (42.8%), and Tesla (39.9%) print hotter volatility.
The identity does not stop at volatility. Bitcoin bottomed on March 29 at $64,869, per today’s BTC analysis. NVDA bottomed on March 30 at $164.04, one session apart.
Want more insights like this? Sign up for Editor Harsh Notariya’s Daily Newsletter here.
Bitcoin rallied 20.72% to an April 17 peak of $78,380. NVDA rallied 22.95% to $201.75 in the same window. Both assets now trade inside near-identical bull flag pattern handles below resistance.
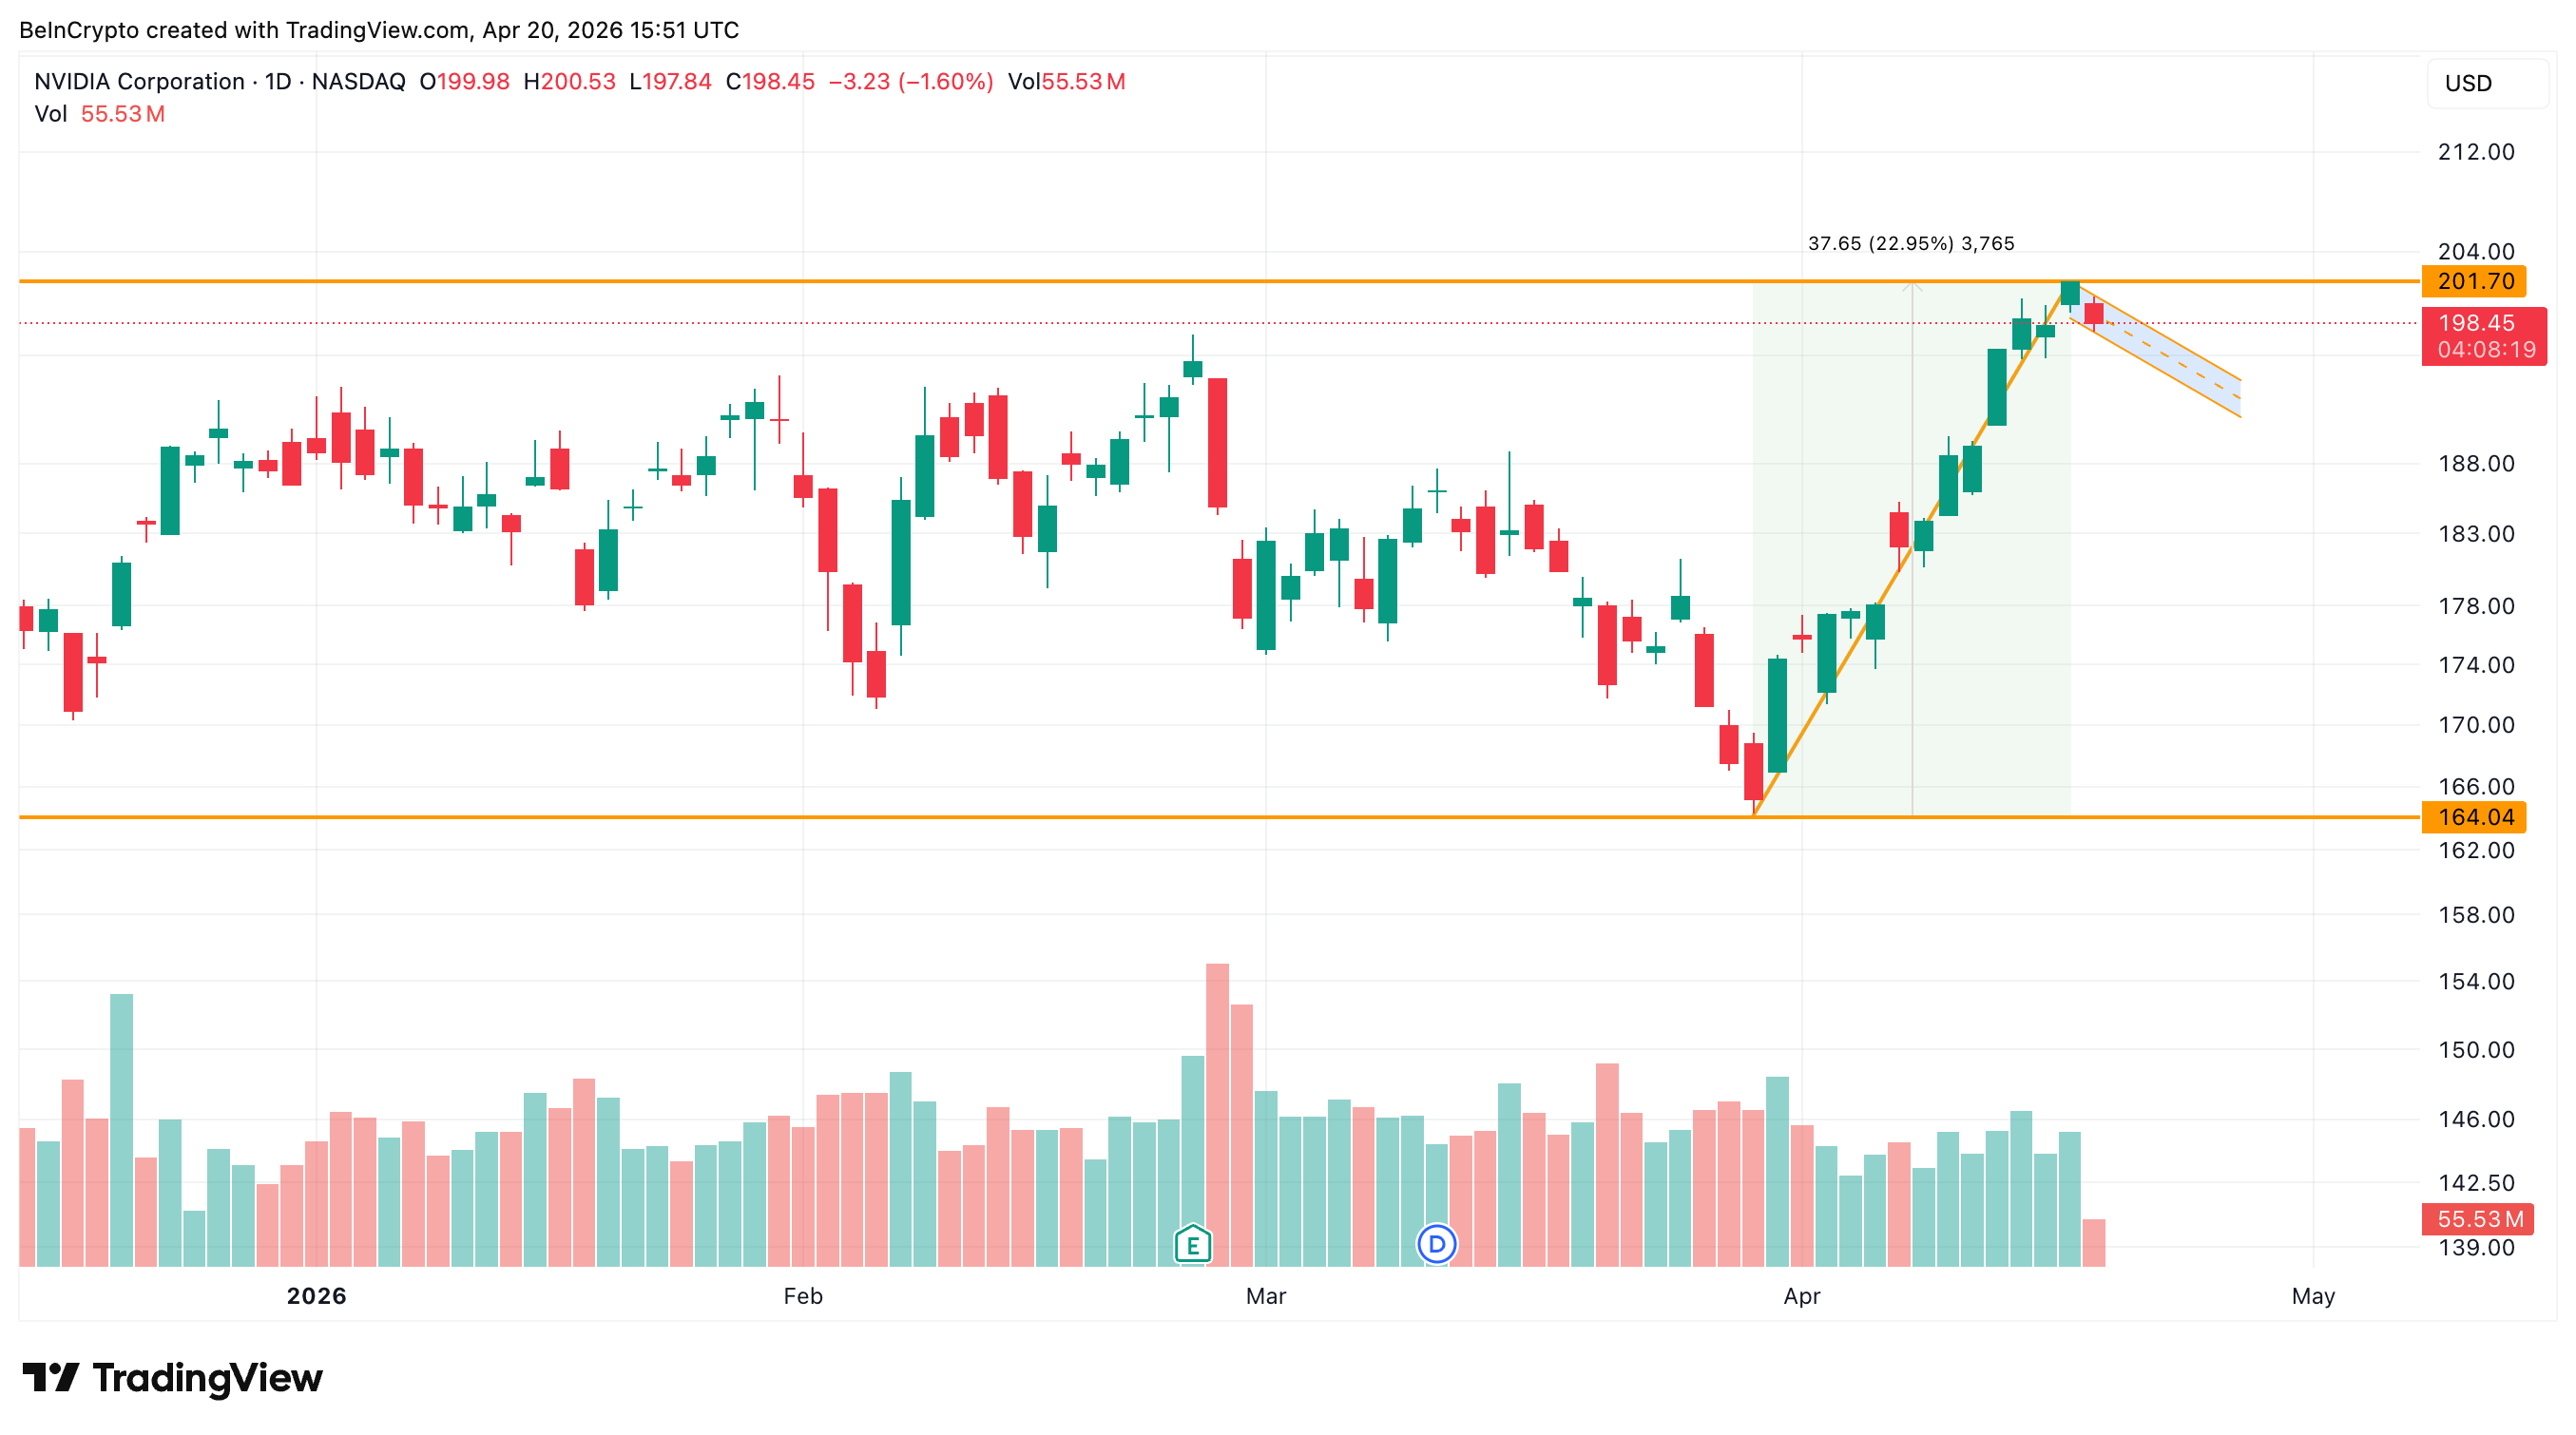
Bitcoin’s measured move projects $90,841, a 21% extension. NVDA’s measured move projects $248, a 23% extension. The geometry is near-symmetric.
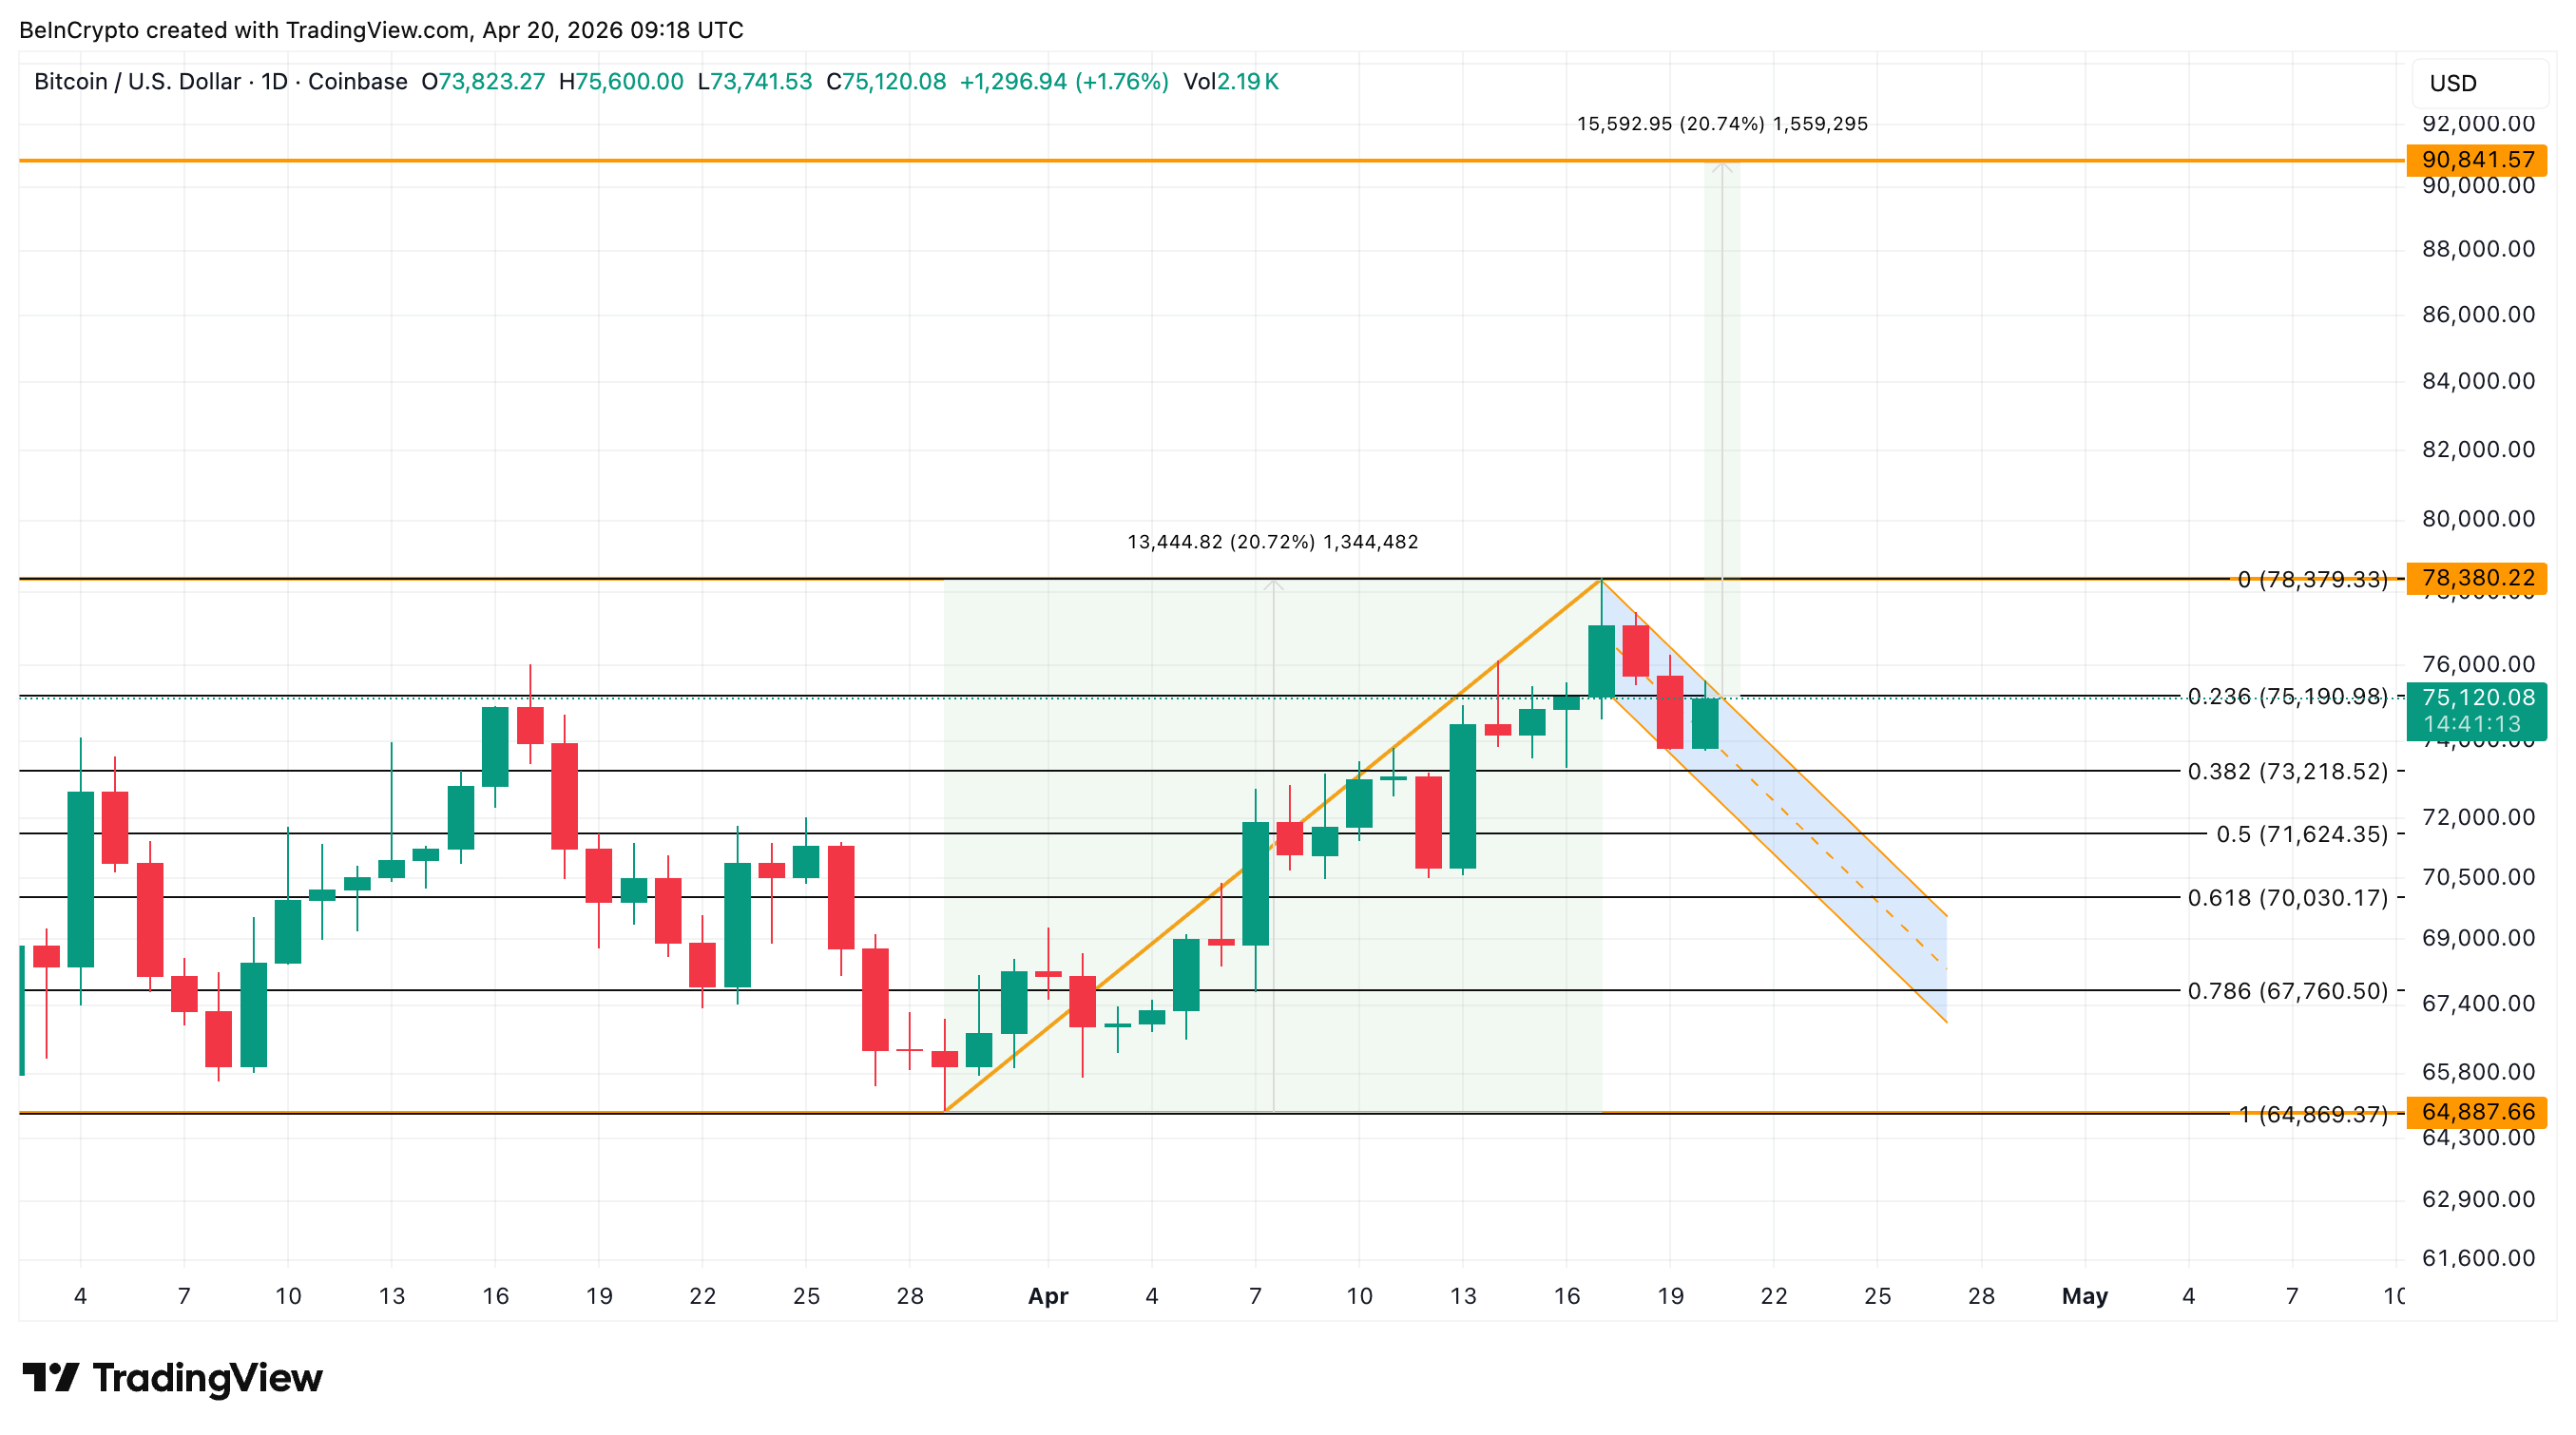
One difference sharpens the read. Bitcoin’s handle shows two rejections at the upper trendline and a long upper wick on April 20. NVDA’s handle shows the opposite footprint, with pullback volume visibly thinner than the seven green candles that built the pole.
Two assets at matched volatility, bottomed together, peaked together, facing the same measured-move math, printing the same pattern. This is not a correlation. The same money is possibly buying both.
The volatility alignment explains the rally size. The next question is whether institutions are actually paying to stay long inside the handle.
Put-Call Ratio Drops as Tariff Refund Clears Tail Risk
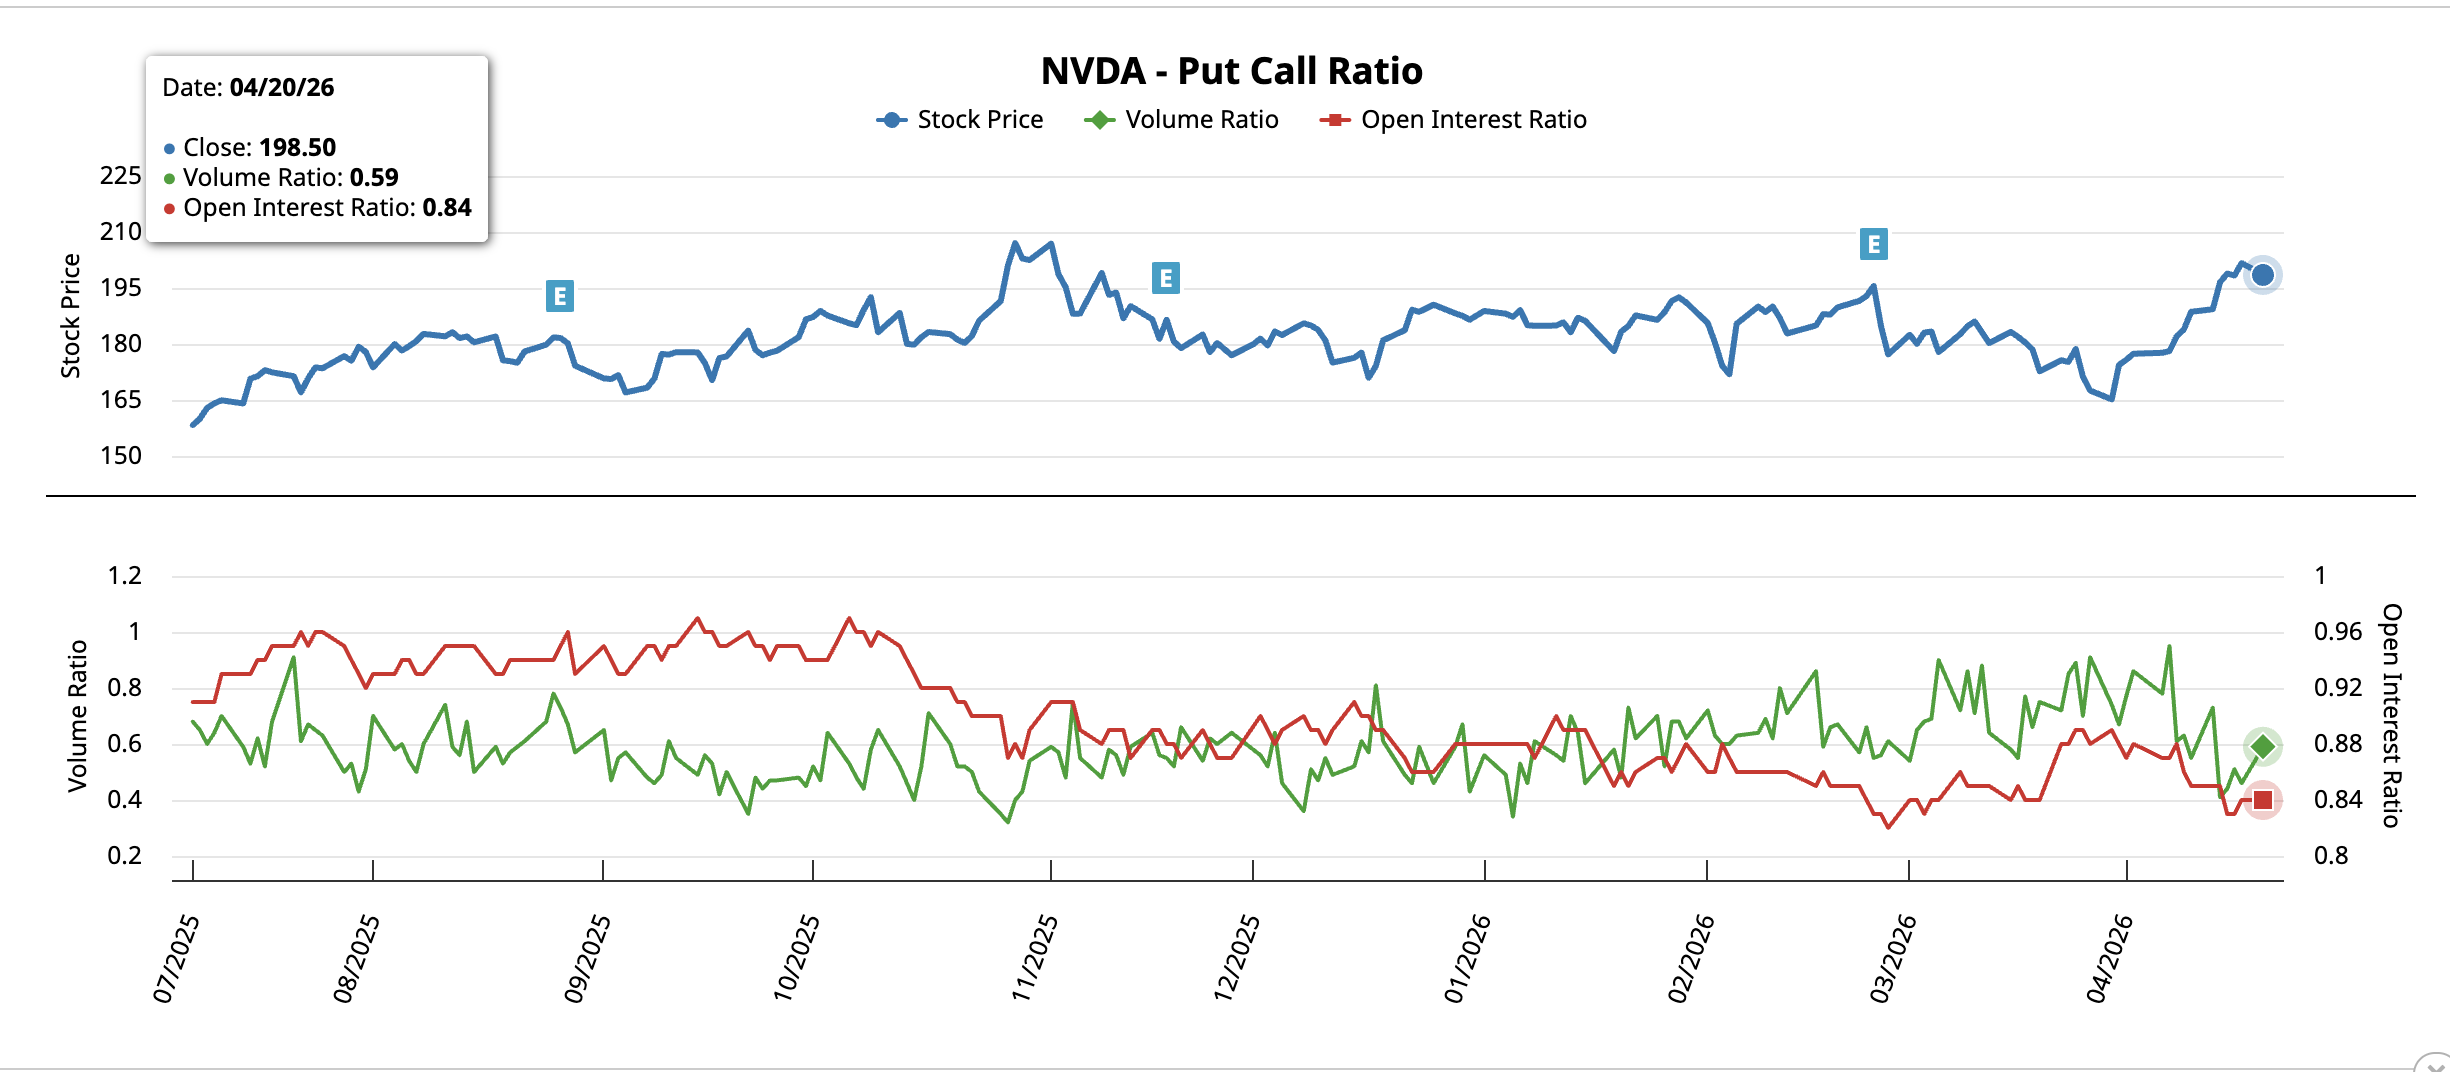
The bull flag needs a demand catalyst inside the handle, and the options tape is already supplying one. NVIDIA’s put-call ratio compares bearish put activity to bullish call activity. The reading has moved lower on both measurement methods since the March 30 pole base.
On March 30, when NVDA bottomed at $164.04, the volume-based ratio read 0.74. The open-interest-based ratio read 0.89. Both sat near the upper end of the post-October 2025 range, reflecting thick downside hedging at the low.
NVDA now trades at $199.24. The volume ratio has fallen to 0.59, and the open interest ratio sits at 0.84. That is a 20% compression in volume and a 6% compression in open interest. Both point in the same direction. Puts (bearish bets) are being closed faster than calls (bullish bets). That is the counterintuitive signal. Hedging usually rises as prices approach resistance. Here it is falling.
Options desks are not buying insurance against the $201.75 rejection.
The catalyst explaining the unwind landed today. The Supreme Court ruled Trump’s reciprocal tariff policy unlawful. The US government has begun refunding up to $166 billion to 330,000 importers across 53 million shipments. Refunds plus interest are scheduled within 60 to 90 days.
NVIDIA’s hardware stack depends on imported components across the global semiconductor supply chain. The tariff rollback reduces forward cost pressure on the AI infrastructure build-out. More importantly, the ruling retires a specific tail risk that had sat on the options curve through 2025. That is the exact risk the puts were pricing, now being dismantled.
Downside protection is cleared with a real catalyst under the tape. The NVIDIA price chart becomes the final decider of how far the bull flag can travel.
NVIDIA Stock Needs $201.75 Close to Activate $250 Target
The NVDA price action has the final call. The pole stalled at $201.75, which is not arbitrary resistance. That zone marks the 0.618 Fibonacci level while plotting the previous swing.
Capital flow confirms the pole was real. Chaikin Money Flow (CMF), a proxy for institutional buying and selling pressure, currently reads 0.21.
CMF traveled from roughly -0.25 at the March low to above zero in mid-April. The indicator then pushed into positive territory as the rally extended. That sequence confirms that real money was rotated in while the pole was being built.
This is why the Bitcoin volatility match is not a statistical coincidence. The same institutional pools are bidding on NVIDIA stock the way they rotate into Bitcoin. Synchronized March bottoms, parallel 21-23% poles, matched 27.7% and 27.8% volatility, and CMF inflows together describe one liquidity regime.
A daily close above $201.75 activates the 23% pole projection, which adds roughly $46 to the breakout trigger. The extension at $253.82 aligns with horizontal resistance at $248.25, suggesting $250 as the average target.
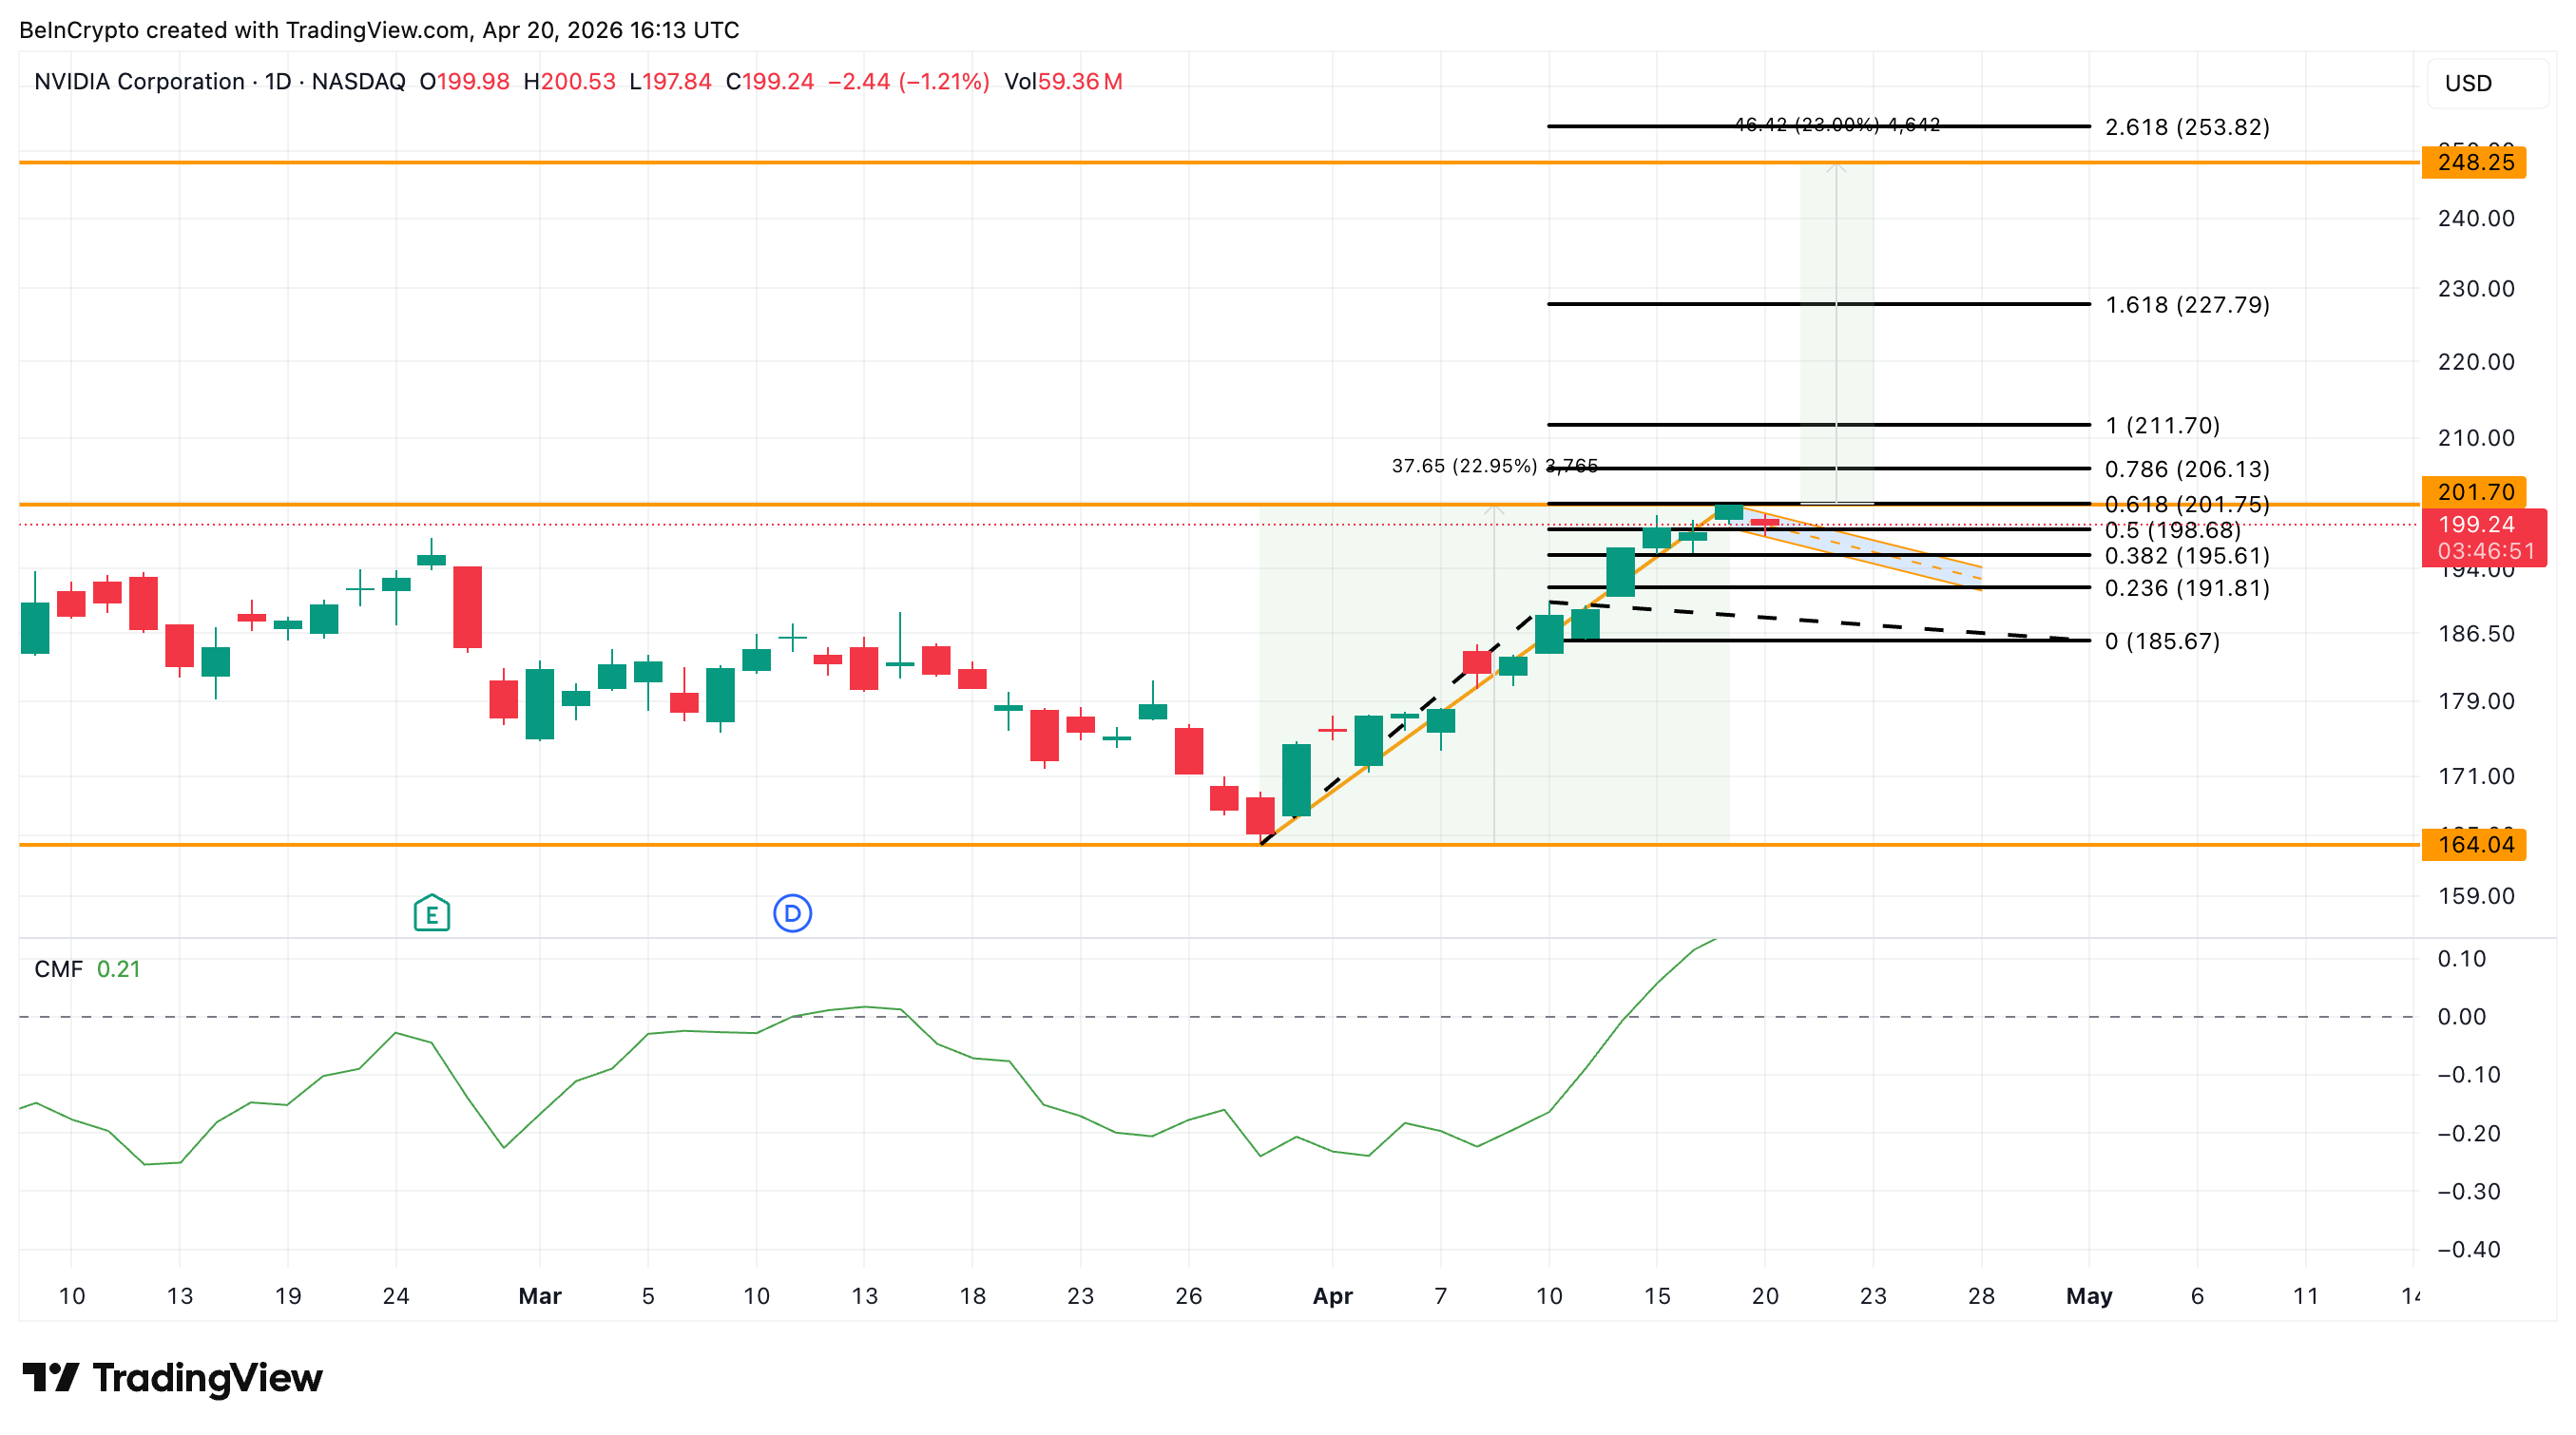
Intermediate checkpoints sit at $211.70 and $227.79. Bull flags in high-volatility regimes can meaningfully widen their handles before resolving. A dip into the $191 zone does not automatically invalidate the pattern. Only a daily close below $185.67 would significantly weaken the structure.
This NVDA price prediction now depends on one level. $201.75 separates the $250 path for NVIDIA stock from a $185.67 retest that would weaken the bull flag.
 Don't Miss Today's Market Moves Start trading Forex, Gold & Crypto today Regulated platform | Fast withdrawals
Disclaimer: The content presented above, whether from a third party or not, is considered as general advice only. CFD trading involves significant risk of loss. Past performance does not guarantee future results. This article serves informational purposes only and does not constitute financial advice. Consider your risk tolerance before trading.


