




MicroStrategy (MSTR) Stock Barely Escapes Cost-Basis Scare — A 20% Price Swing Awaits?


After weeks of heavy pressure, down over 12%, MicroStrategy stock is trying to stabilize. Bitcoin’s rebound near $79,000 at press time helped ease fears around the company’s average cost basis, which briefly dominated market sentiment in late January.
For a while, investors worried that a deeper Bitcoin price drop could push MSTR into unrealized losses. Now that the immediate risk has faded, attention is shifting to whether a price recovery can surface. Correlation data, capital flows, and price structure suggest the stock has entered a high-risk zone, where the next major BTC move could shape its direction for weeks.
Bitcoin Correlation Explains Why MicroStrategy Fell Faster
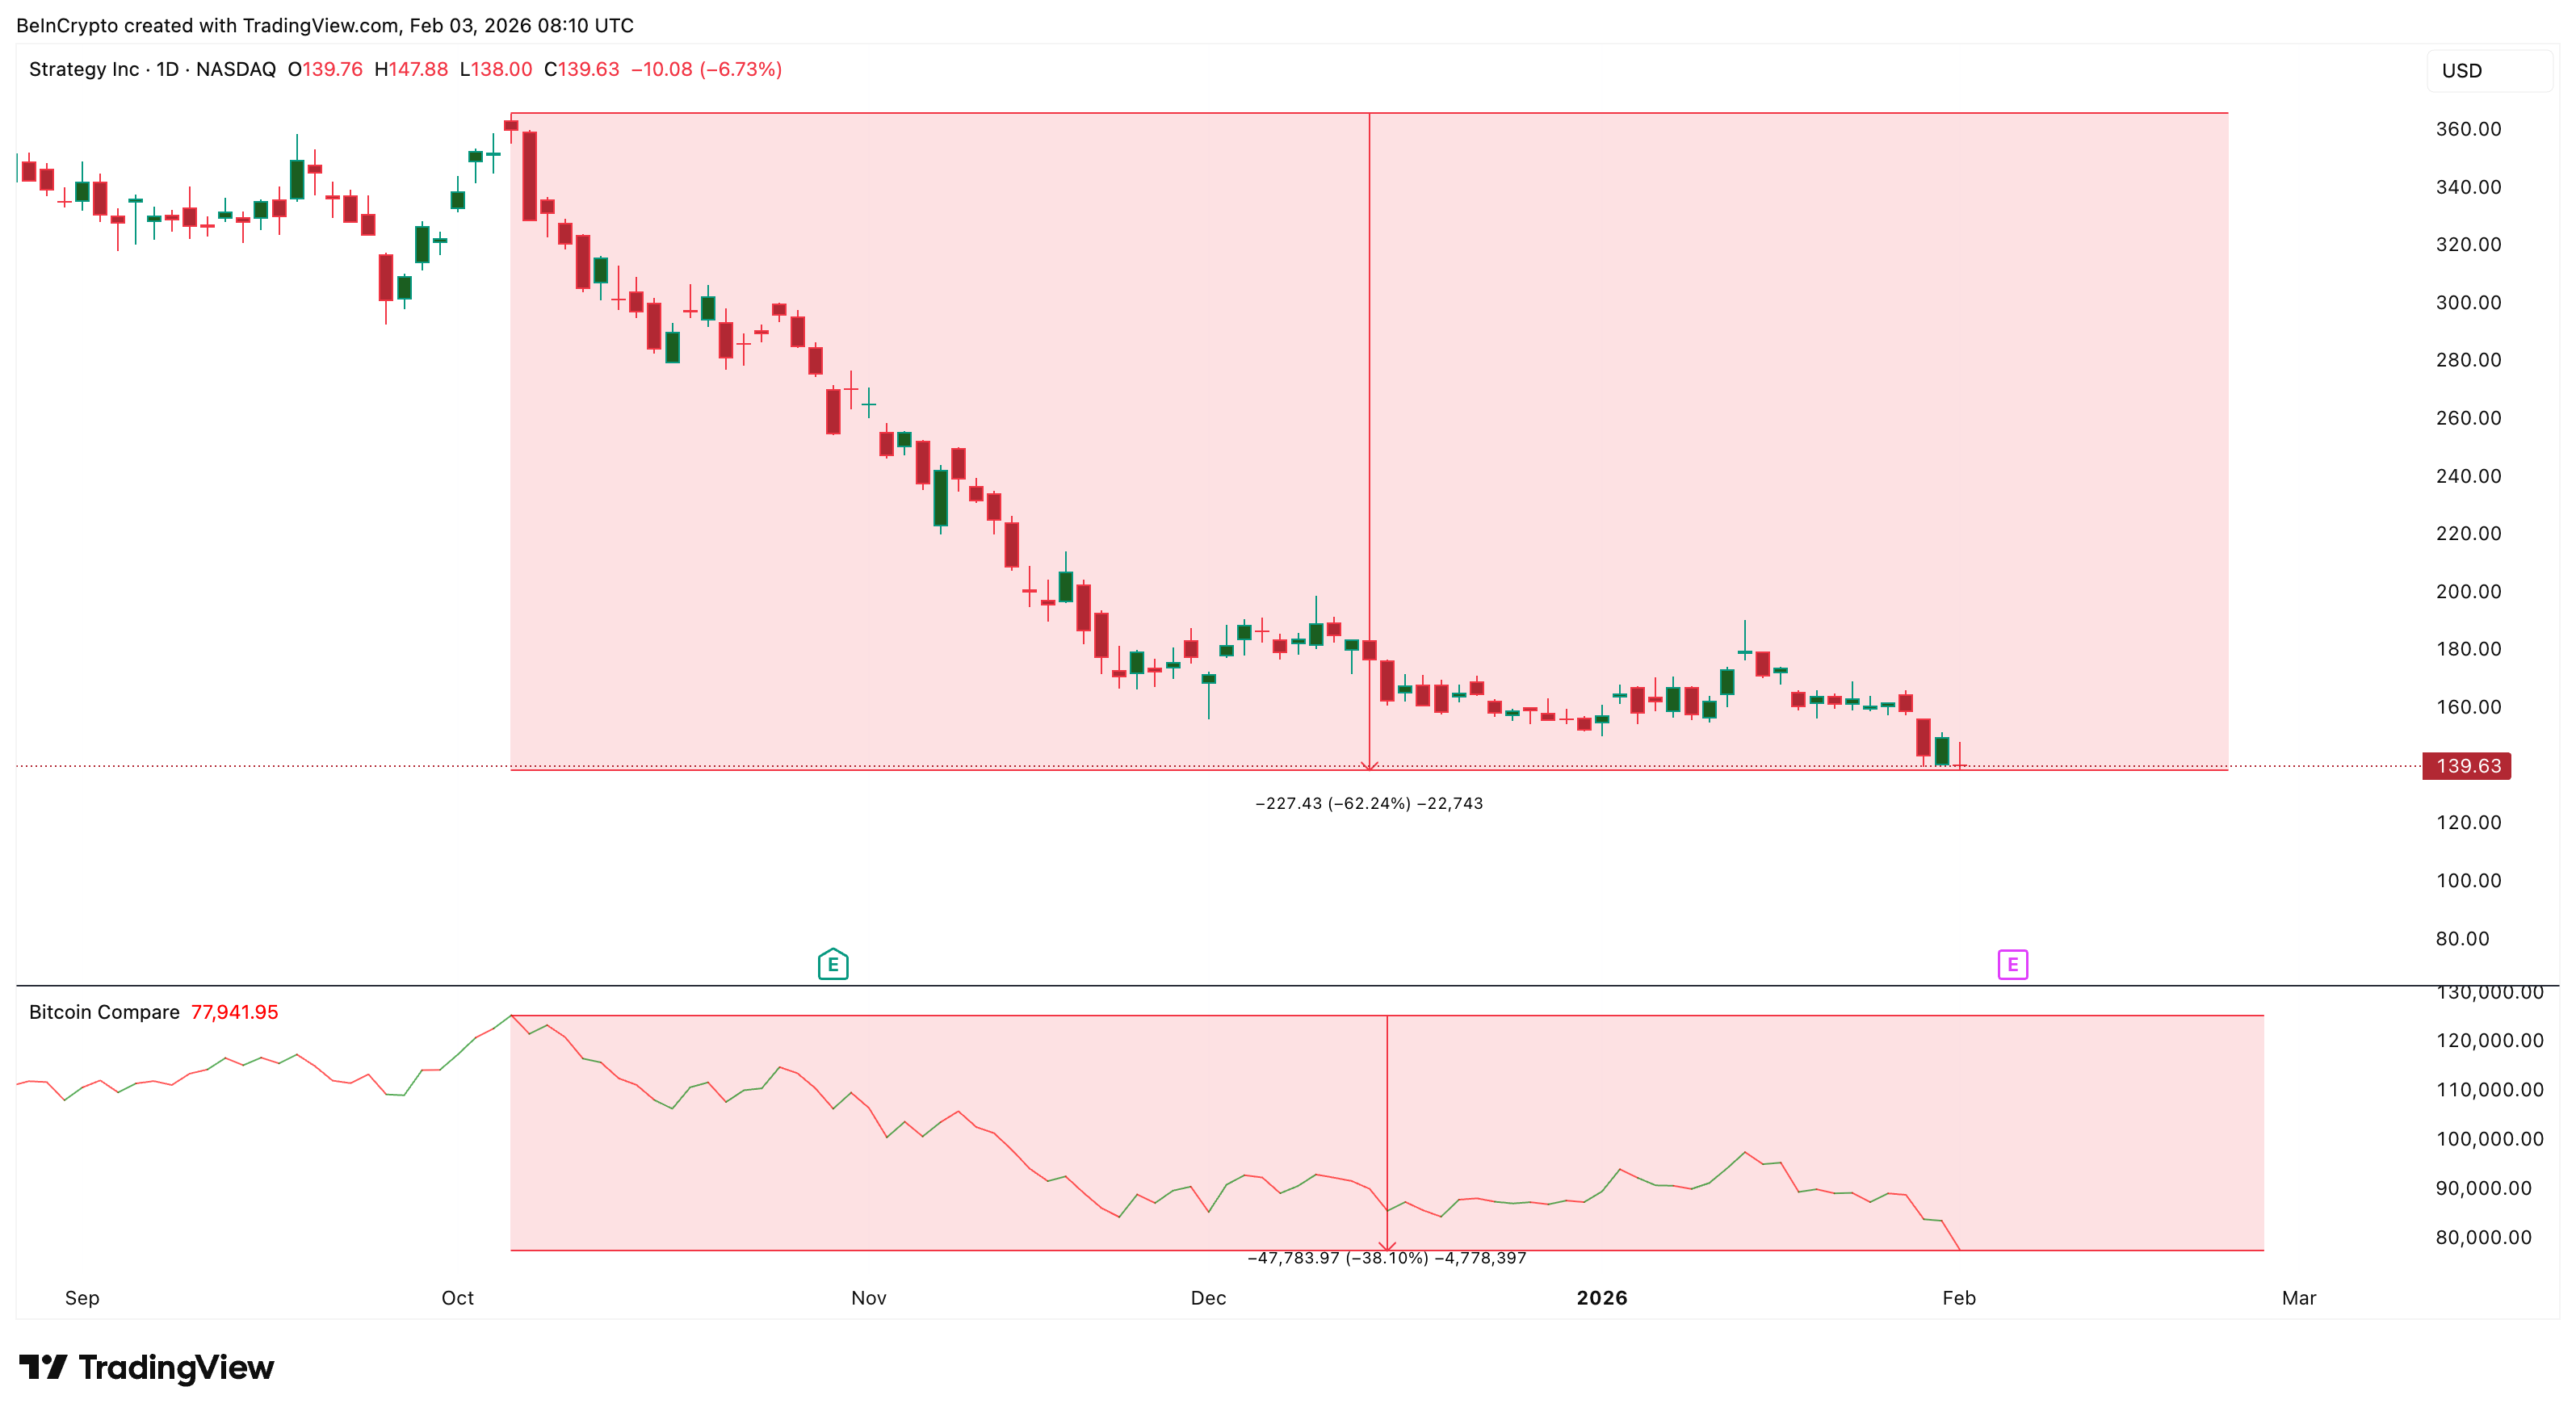
Since early October, MicroStrategy has fallen by roughly 62%, while Bitcoin has declined about 38% over the same period. This gap highlights how MSTR behaves like a leveraged version of Bitcoin. When Bitcoin weakens, MicroStrategy usually falls harder because investors also factor in balance-sheet exposure, debt, and sentiment risk.
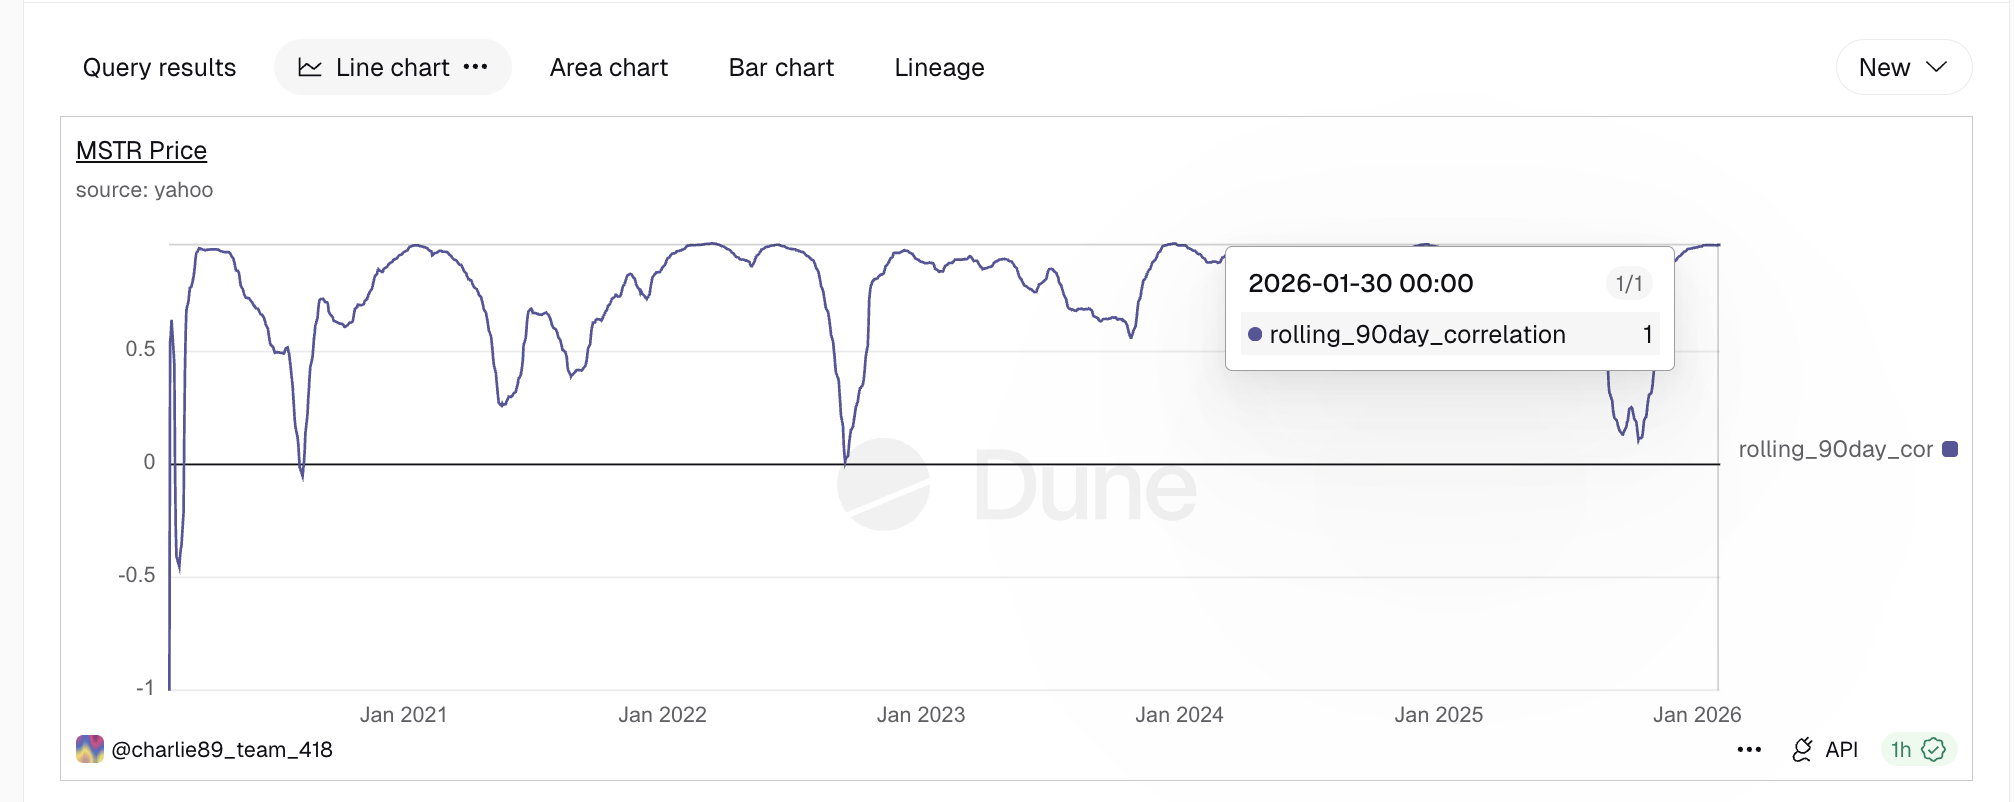
Dune data support this relationship. The 90-day rolling correlation between MSTR and Bitcoin is close to 0.97 (close to 1), which means the two assets have been moving in the same direction almost every day.
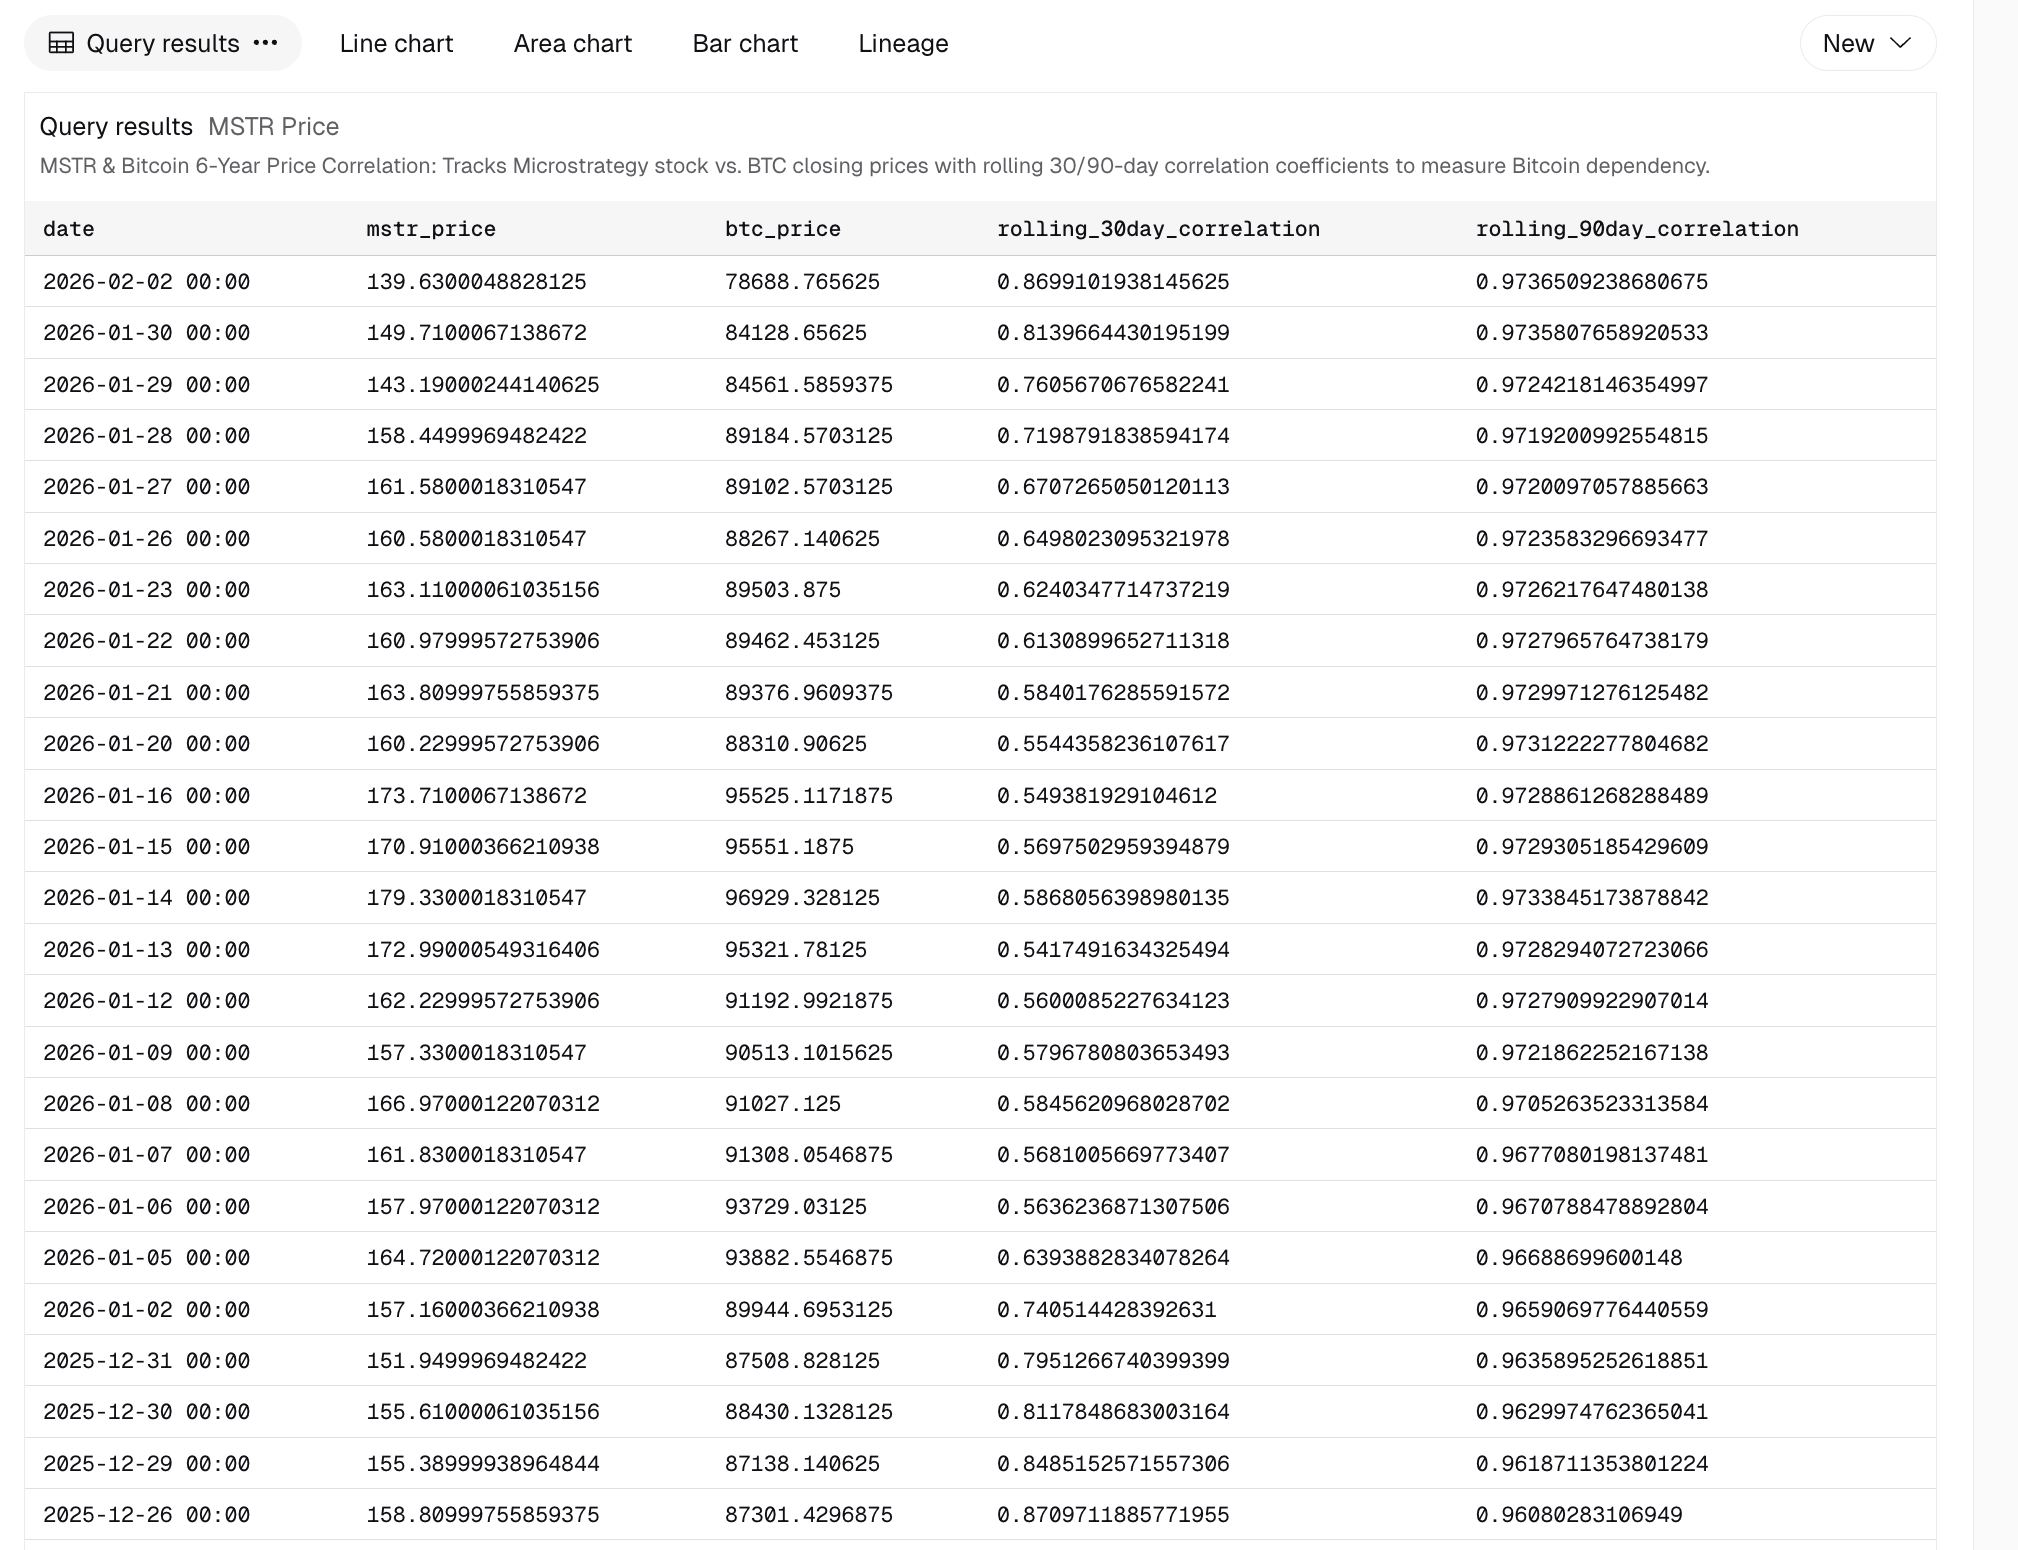
However, this does not contradict the larger drawdown. Correlation measures direction, not size. It shows that MSTR follows Bitcoin’s trend, but leverage and structural risks amplify the moves.
This dynamic became clear in late January, when Bitcoin briefly dipped under MicroStrategy’s average purchase price of around $76,000. That moment triggered fears of unrealized losses and added pressure on the stock. Bitcoin’s rebound above $78,000 reduced that threat and helped calm sentiment.

Still, the correlation remains extremely high. If Bitcoin weakens again, the MSTR stock price is likely to follow, which keeps downside risk elevated.
Money Flow And Volume Send Mixed Signals
Capital flow data presents a more complex picture. The Chaikin Money Flow (CMF), which measures whether money is entering or leaving an asset using price and volume, has been trending higher since mid-January. Between January 14 and February 2, MSTR stock prices moved lower, yet CMF continued rising. This bullish divergence suggests that large investors were quietly accumulating during weakness.
Want more token insights like this? Sign up for Editor Harsh Notariya’s Daily Crypto Newsletter here.
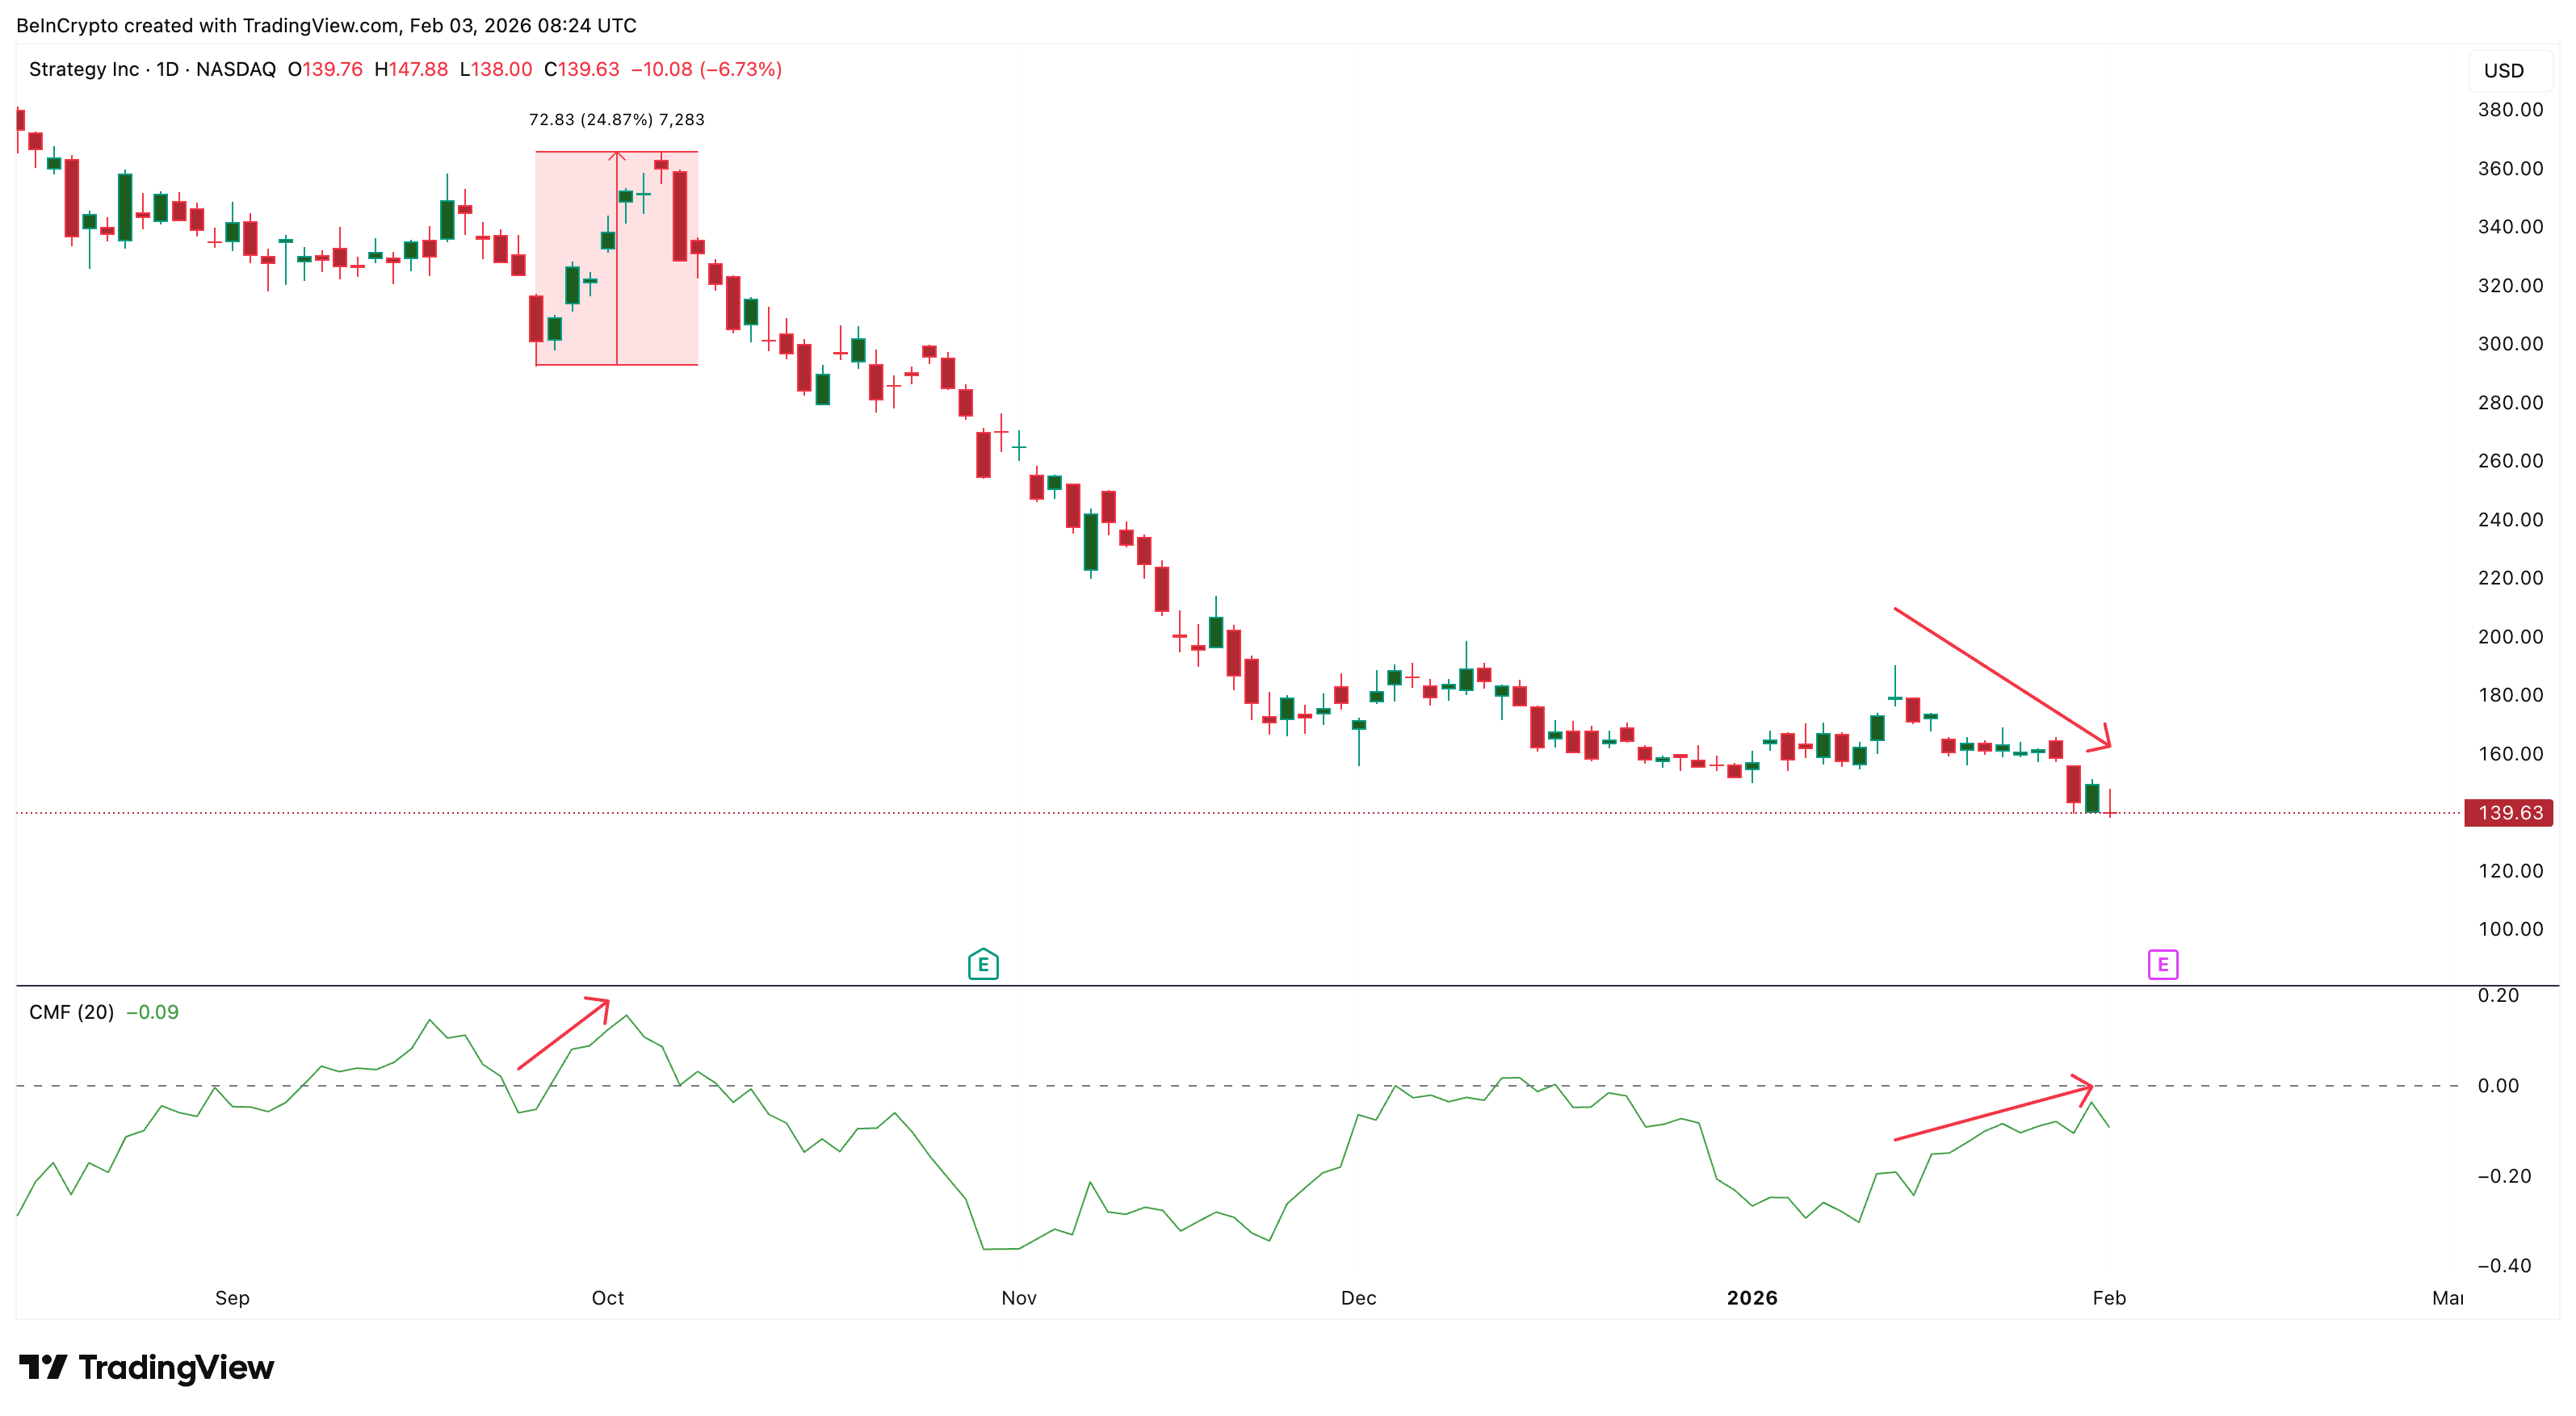
CMF is now approaching the zero line, which separates net inflows from net outflows. A sustained move above zero would confirm that buying pressure is outweighing selling. The last clean break above this level came in early September, after which the stock rallied nearly 25%. This makes CMF a key trigger for any recovery attempt.
However, the MicroStrategy stock volume tells a different story. On-Balance Volume (OBV), which tracks whether trading volume supports price trends, has been trending lower. During the recent decline, OBV fell alongside price and broke below its rising trendline. This signals weakening participation and fading retail interest.
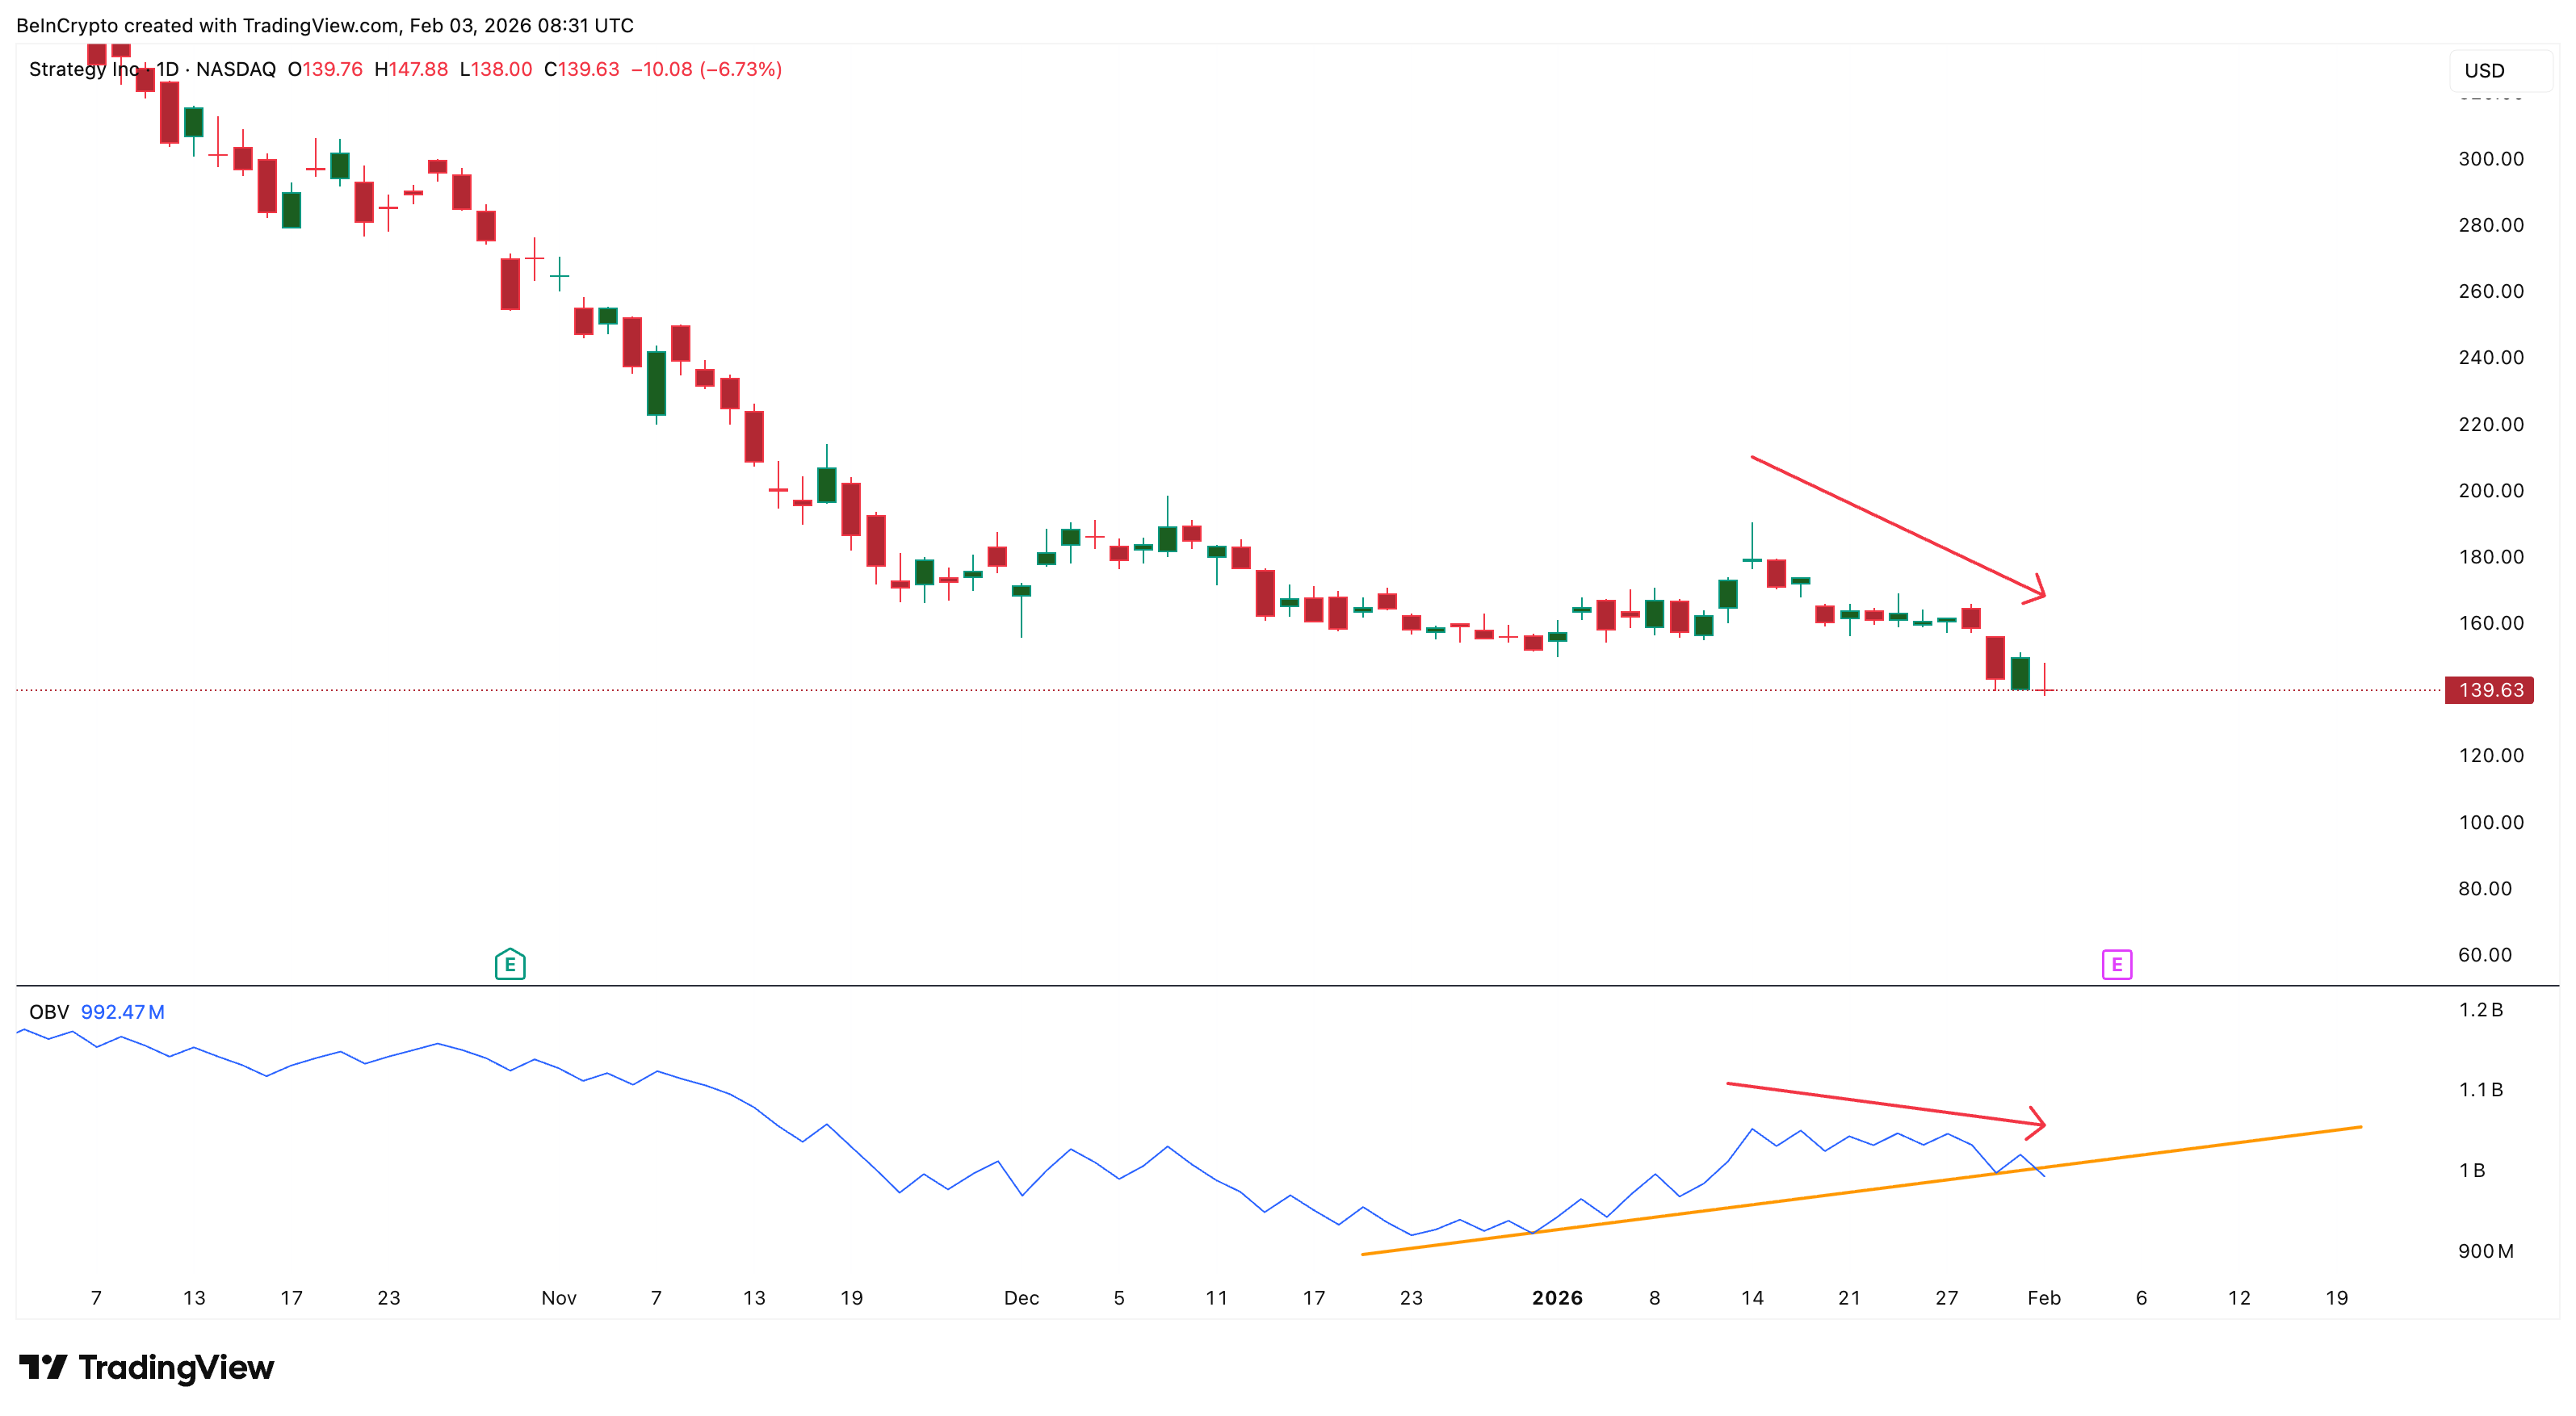
Together, these indicators send mixed signals. CMF points to selective accumulation by larger players, while OBV shows that broader market engagement remains weak, probably due to the recent cost-basis hit.
When these metrics diverge, rallies often struggle to gain momentum. Without strong participation, upside moves tend to fade quickly. As a result, even if institutions are positioning early, sustained gains will likely require stronger Bitcoin performance.
Key MicroStrategy Stock Price Levels Show a 20% Decision Zone Ahead
With indicators sending conflicting messages, the MSTR price levels now matter more than ever. The most important support sits near $139. This level has held multiple tests and aligns with Fibonacci support from the October decline, making it the market’s main decision point.
If $139 fails on a daily close, downside risk would increase sharply. In that scenario, prices could slide toward $107, implying roughly 20% further downside. Such a move would likely coincide with renewed weakness in Bitcoin. A deeper breakdown would likely coincide with renewed Bitcoin weakness.
On the upside, the first major resistance is near $170, also at around 20% from current levels. This level has capped several rebound attempts and remains a key barrier. A sustained break above $170 would improve the technical structure and signal returning confidence. Above that, the next hurdle sits near $190.
Clearing this zone would shift the trend decisively bullish and confirm that capital inflows are translating into price strength.
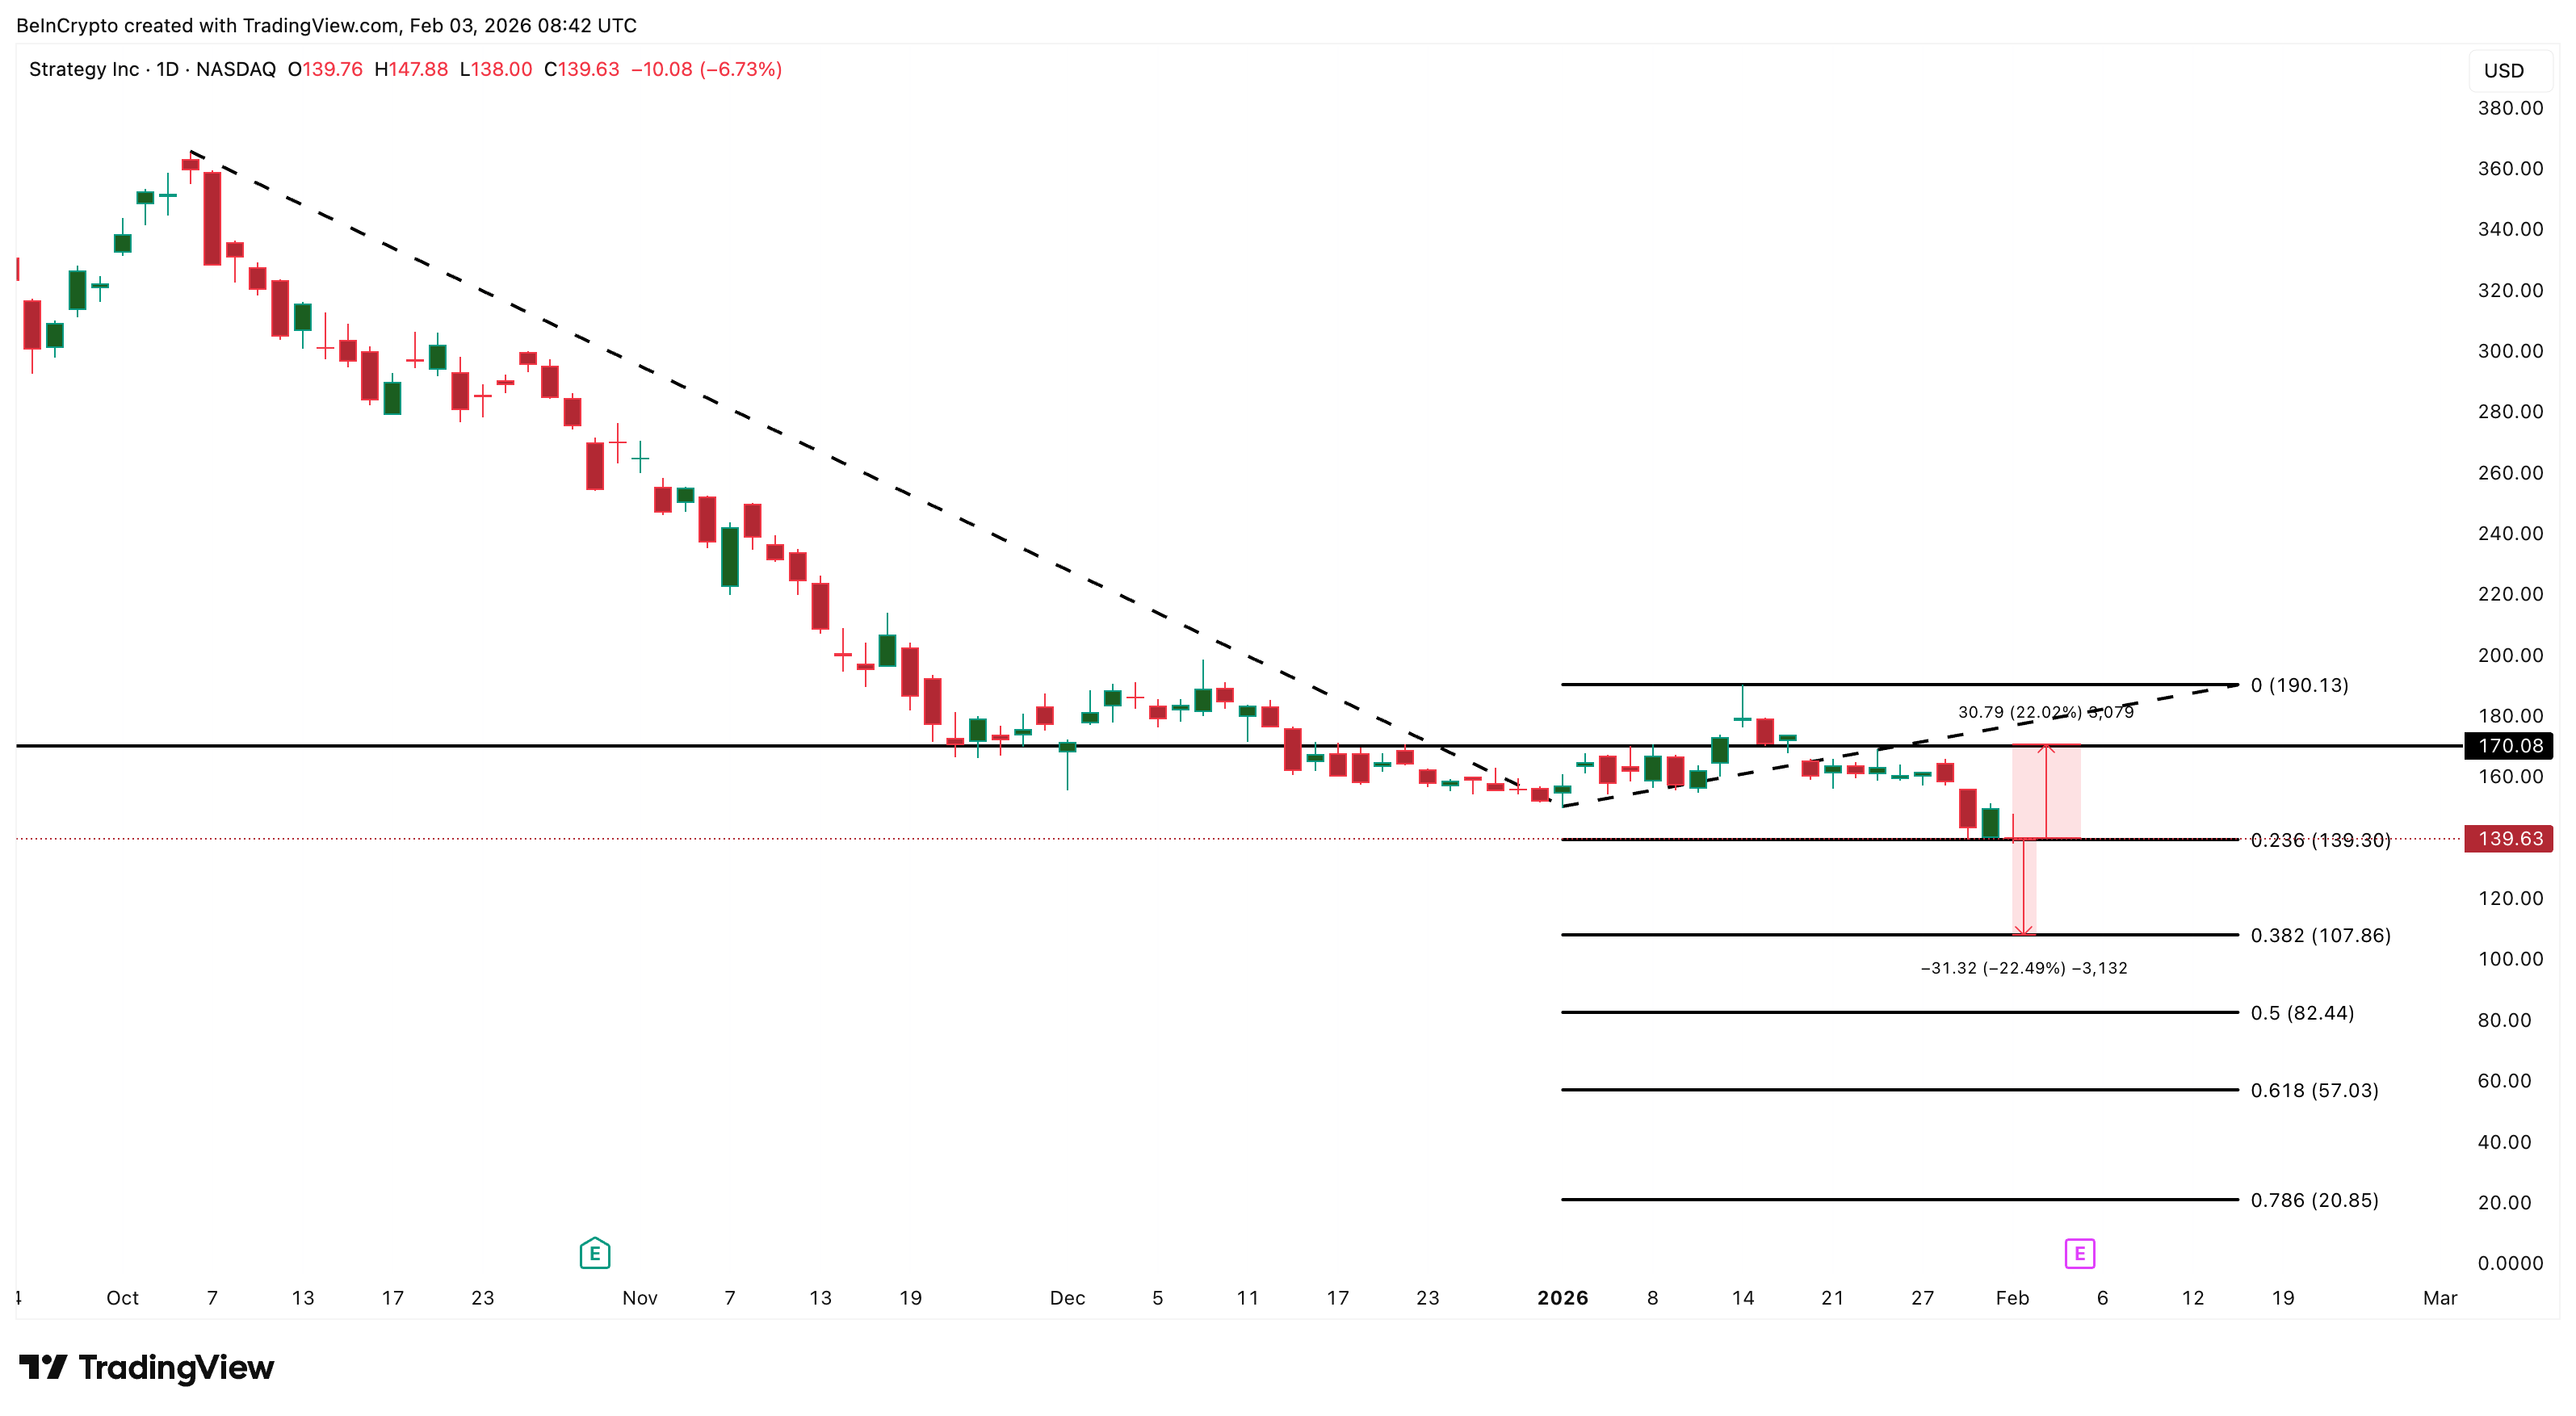
At present, MicroStrategy is centered near $139, with risk toward $107 and resistance near $170. This wide range represents nearly 20% in either direction, forming a two-sided decision zone. Bitcoin’s behavior will likely determine which side breaks first. A move above $80,000 could help MSTR challenge $170, while continued choppiness may prolong consolidation. If Bitcoin turns lower, support near $139 becomes vulnerable.
Until a clear breakout occurs, volatility is likely to remain high, and every rally risks reversal.
Disclaimer: The content presented above, whether from a third party or not, is considered as general advice only. CFD trading involves significant risk of loss. Past performance does not guarantee future results. This article serves informational purposes only and does not constitute financial advice. Consider your risk tolerance before trading.


