




Warren Buffett’s Warning Could Haunt Wall Street in 2027. History Says the Stock Market Could Make a Big Move.
Key Points
Earlier this year, Warren Buffett warned Wall Street that investors are treating the stock market like a casino.
The S&P 500’s CAPE ratio has topped 40 in five straight months, a valuation last seen during the dot-com crash.
Warren Buffett has often argued that interest rates are the most important variable in determining stock market valuations.
- Motley Fool Issues Rare "Total Conviction" Buy Alert ›
Warren Buffett, now 96 years old, has largely retreated from the public spotlight. He stepped down as CEO of Berkshire Hathaway last year, and he relinquished his role as chairman last month.
However, Buffett sat down for an interview with CNBC in May, during which he warned that investors were treating the stock market like a casino. "We've never had people in a more gambling mood than now."
Missed Nvidia in 2009? This Rare Signal Is Flashing Again. In 2009, a "Double Down" signal flashed for a little-known chipmaker called Nvidia. For the first time in years, that same "Total Conviction" signal is flashing for a company 1/100th the size of Nvidia. Continue »
Year to date, the S&P 500 (SNPINDEX:^GSPC) has added 12% and the Nasdaq Composite (NASDAQINDEX:^IXIC) has advanced 13%, but Buffett's warning could haunt Wall Street in 2027. History says the stock market is headed for a drawdown.
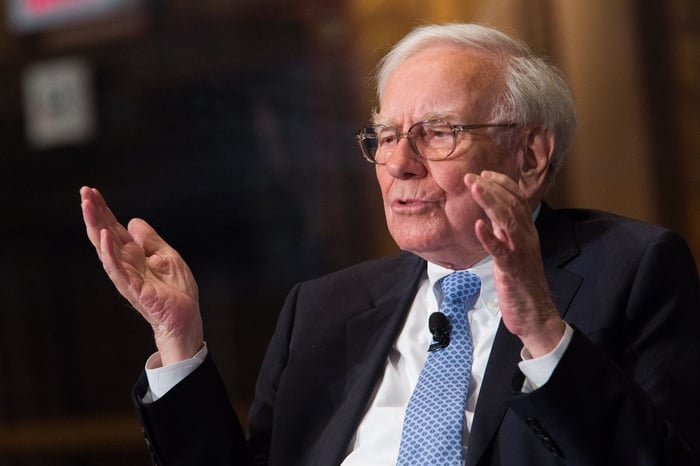
Image source: Getty Images.
Rich valuations hint at a stock market correction in 2027 and a bear market in 2028
In 1988, Nobel Prize-winning economist Robert Shiller and his colleague John Campbell created the cyclically-adjusted price-to-earnings (CAPE) ratio to assess stock valuations and forecast long-term returns. Unlike the conventional price-to-earnings (PE) ratio, which uses earnings from the last four quarters, the CAPE ratio filters out fluctuations in the business cycle by using inflation-adjusted earnings from the past decade.
The S&P 500 recorded an average CAPE multiple of 40.6 in September. Apart from the last five months, that is the highest valuation since the dot-com crash in 2000. In fact, since the S&P 500 was created in 1957, it has recorded a monthly CAPE multiple above 40 on just 26 occasions (about 3% of the time). And the index has usually performed poorly in the aftermath.
The chart below shows the S&P 500's average return over different time periods following instances when its monthly CAPE multiple has exceeded 40.
| Time Period | S&P 500’s Average Return |
|---|---|
| 12 months | (3%) |
| 18 months | (10%) |
| 24 months | (19%) |
Data source: Robert Shiller. The chart above shows the S&P 500's average return when the index's monthly CAPE ratio has been 40 or higher.
As shown above, following a monthly CAPE reading above 40, the S&P has dropped by an average of 3% over the next year, 10% over the next 18 months, and 19% over the next two years.
What does that imply? The S&P 500's CAPE multiple first crossed 40 in May 2026, and the index finished the month at 7,580. If its performance matches the historical average, the following will happen:
- The S&P 500 will drop 10% to 6,822 by November 2027. That implies 13% downside from its record high of 7,819, meaning the index will enter correction territory.
- The S&P 500 will drop 19% to 6,140 by May 2028. That implies 21% downside from its record high of 7,819, meaning the index will enter bear market territory.
Here's the big picture: The S&P 500 is expensive by historical standards, so much so that its current valuation hints at substantial losses in the coming months. Of course, past performance is never a guarantee of future results, but investors should be aware of the situation.
Federal Reserve interest rate hikes could trigger a stock market correction before 2027
Warren Buffett believes interest rates are the most important factor in determining stock valuation. In fact, he once compared prevailing interest rates to gravity, explaining that higher rates put downward pressure on equity prices, while lower rates support higher valuations.
In September, the Federal Open Market Committee (FOMC) voted unanimously to raise its benchmark interest rate by 25 basis points, marking the onset of new rate-hike cycle. Previously, the Fed had initiated three rate-hike cycles in the last 25 years, and they generally correlated with stock market corrections.
Specifically, over the last 25 years, the S&P 500 and Nasdaq Composite dropped by an average of 10% and 12%, respectively, at some point during the three-month period following the first rate hike in a new cycle.
What does that imply? The S&P 500 closed at 7,638, and the Nasdaq Composite closed at 26,418 after the Federal Reserve raised interest rates on Sept. 17. If those indexes perform in line with their historical averages, the following will happen.
- The S&P 500 will drop 10% to 6,874 sometime before the end of the year. That implies 12% downside from its record high of 7,819.
- The Nasdaq Composite will drop 12% to 23,248 sometime before the end of the year. That implies 16% downside from its record high of 27,600.
Here's the big picture: Interest rate hikes are typically bad news for the stock market. Not only do bonds look increasingly attractive relative to stocks as interest rates increase, but higher borrowing costs also directly reduce corporate earnings. If interest rates continue to rise in the remaining months of the year, stock market investors could suffer substantial losses, especially if Wall Street revises earnings estimates lower.
Should you buy stock in S&P 500 Index right now?
Before you buy stock in S&P 500 Index, consider this:
The Motley Fool Stock Advisor analyst team just identified what they believe are the 10 best stocks for investors to buy now… and S&P 500 Index wasn’t one of them. The 10 stocks that made the cut could produce monster returns in the coming years.
Consider when Netflix made this list on December 17, 2004... if you invested $1,000 at the time of our recommendation, you’d have $355,124!* Or when Nvidia made this list on April 15, 2005... if you invested $1,000 at the time of our recommendation, you’d have $1,296,254!*
Now, it’s worth noting Stock Advisor’s total average return is 901% — a market-crushing outperformance compared to 210% for the S&P 500. Don't miss the latest top 10 list, available with Stock Advisor, and join an investing community built by individual investors for individual investors.
See the 10 stocks »
*Stock Advisor returns as of October 27, 2026.
Trevor Jennewine has no position in any of the stocks mentioned. The Motley Fool has positions in and recommends Berkshire Hathaway. The Motley Fool has a disclosure policy.
Recommended Articles


