




Alphabet Stock Price Forecast: Can Expanding Access to Gemini 4 Argon Help Its Stock Recover?
TradingKey - On October 13, Google expanded access to Gemini 4 Argon, rolling out the model to developers, enterprises, and select paid users, offering services via APIs, the Gemini app, and Search AI Mode. Use cases cover professional tasks such as coding, finance, and law, further broadening the commercialization channels for Google's AI technology.
For Alphabet (GOOG) (GOOGL), the new model provides a basis for improving market perception of its AI competitiveness. Its potential support for the stock price comes from two aspects: easing concerns about lagging behind in technology, and providing new possibilities for future revenue growth. However, there is still a distance that needs to be validated from product launch to profit realization.
Can Model and Distribution Advantages Translate Into Revenue Growth?
With the expanded rollout of Gemini 4 Argon, enterprise customers can integrate it into actual workflows, while consumers can access the new model through Google's existing products. This creates favorable conditions for Google to capture paid demand while providing investors an opportunity to observe whether technical capabilities can translate into sustained usage and revenue.
BNP Paribas analyst Nick Jones is bullish on Google's AI research, proprietary computing infrastructure, distribution channels, and financial resources, setting a $420 price target for Alphabet. He also believes Google may offer more pricing options tailored to different use cases in the future and leverage its existing ecosystem to distribute consumer-facing AI agents.
From a stock price transmission perspective, if enterprise trials convert into formal deployments and API calls as well as paid subscriptions continue to increase, investors may raise their expectations for Google's AI revenue and return on investment. Before financial contributions fully materialize, a reassessment of competitive risks could also provide support for its valuation.
However, the connection between model test scores and actual customer experience still requires validation. According to Jefferies analyst Brent Thill, Google still needs to prove that benchmark gains can translate into real-world performance. Whether customers are willing to continue paying will speak more to the quality of commercialization than rankings in a single test.
How Much Profit Return Can Low-Cost Customer Acquisition Bring?
Pricing is a key focal point of this release. Google has set the promotional price for the Argon standard API at $2 per million input tokens and $10 per million output tokens, with a 95% discount on cached inputs. However, the official pricing page specifies that this promotional rate is valid through November 30, and input and output prices will rise to $4 and $20, respectively, starting December 1.
Therefore, the current price advantage must be understood in the context of the promotional period. Lower usage costs may attract developers to experiment and help enterprises launch deployments; once standard pricing resumes, customer retention and the sustainability of call volumes will dictate the durability of revenue growth.
There are also caveats on the margin side. New demand requires computing resource support; if serving costs escalate too rapidly, or if competitors respond with price cuts, expanding scale will not necessarily yield parallel margin improvements. For the stock price, revenue growth and earnings quality must be evaluated together.
Alphabet will hold its third-quarter earnings call on October 28. Management's commentary regarding Argon demand, commercialization roadmaps, and related capital commitments will be worth monitoring. Given that the model's broader release has just begun, its top- and bottom-line contributions will need to be tested over subsequent quarters.
At this stage, Argon serves as a catalyst to rebuild competitive confidence for Alphabet. If subsequent paid demand exceeds market expectations alongside manageable serving costs, the stock price could receive more solid support. Conversely, if engagement remains largely confined to promotional trials and tech demonstrations, the product's hype may offer only limited boost to valuation.
Google Technical Analysis
Looking at Alphabet's stock chart, the current price has fallen below the moving average cluster and intraday broke below the key retracement level of $341.48. The stock is currently weakening again after a range-bound rebound was resisted, and is testing buying support at the lower part of the consolidation range, though a downward breakdown of the entire range has not yet been confirmed.
From a macro structure perspective, after surging in May, the stock entered a correction, and the August rebound failed to regain previous highs before gradually transitioning into a horizontal consolidation. The recent rebound encountered resistance again at the top of the consolidation range, and the latest bearish candlestick pierced through the moving average cluster, indicating that the previous rally had not established a stable uptrend, with selling pressure within the range regaining the upper hand.
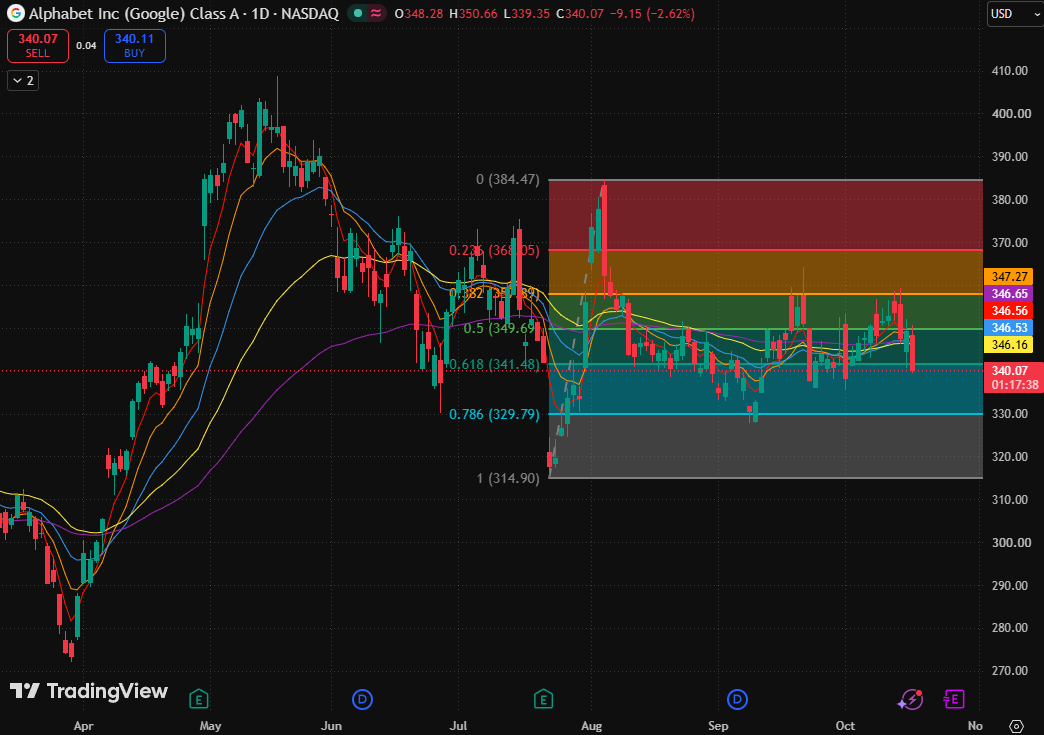
GOOGL stock chart, Source: TradingView
Measuring from the rally range of $314.90 to $384.47, the stock previously fought repeatedly around the 0.5 Fibonacci retracement level ($349.69) and has now tested lower to fall below the 0.618 Fibonacci retracement level ($341.48). This indicates that this level serves as the sole pivot distinguishing a brief dip from a deepening correction.
Regarding moving averages, the 5-day, 10-day, and 20-day exponential moving averages stand at $346.59, $347.29, and $346.54, respectively, while the 80-day and 160-day exponential moving averages are at $346.17 and $346.65. The five moving averages are highly converged and do not yet form a fully bearish alignment, but the price has fallen below all moving averages, implying that the pending directional move is leaning downward.
The current key level lies in whether the stock can reclaim the moving average cluster ($346.17 to $347.29); only when the price recovers to this level will conditions be set to trigger a new wave of rebound.
As for downside risks, if the stock continues to fail to hold the 0.618 Fibonacci retracement level ($341), this price level will shift from support to resistance, causing the price to further retest around $330. If that level also fails to hold, the horizontal consolidation will face the risk of extending downward.
Another risk is that even after briefly regaining the pivot, the rebound remains suppressed by the dense cluster of moving averages, forming a shallow bounce followed by another move lower. Only by regaining the moving average band and finding solid buying support will the current bearish stance be significantly alleviated.
Recommended Articles


