




Stock Market Warning Signal Seen Only 5 Times Since 1871 Points to Serious Downside Risk
Key Points
The Shiller CAPE ratio is a way to compare S&P 500 index valuations across longer-term time periods.
Previous peaks in this ratio have sometimes happened right before a big stock market crash.
The CAPE ratio is currently at one of the highest levels it's ever reached -- but a market crash might not follow.
- 10 stocks we like better than S&P 500 Index ›
Is now a good time to invest in stocks? Or is the stock market overheated, overpriced, and due for a big sell-off? The answer depends on your time horizon and overall financial goals. But some investors are worried about a widely respected valuation metric called the Shiller CAPE ratio. This metric keeps track of cyclically adjusted price-to-earnings for the S&P 500 index (SNPINDEX: ^GSPC).
The Shiller CAPE ratio uses stock market data going back to 1871. During the past 155 years, it has only peaked above 30 on five occasions. Several of those peaks happened right before big stock market downturns:
Missed Nvidia in 2009? This Rare Signal Is Flashing Again. In 2009, a "Double Down" signal flashed for a little-known chipmaker called Nvidia. For the first time in years, that same "Total Conviction" signal is flashing for a company 1/100th the size of Nvidia. Continue »
- 1929 -- right before the Great Depression
- 1999 -- right before the bursting of the dot-com bubble
- October 2021 -- right before the 2022 bear market
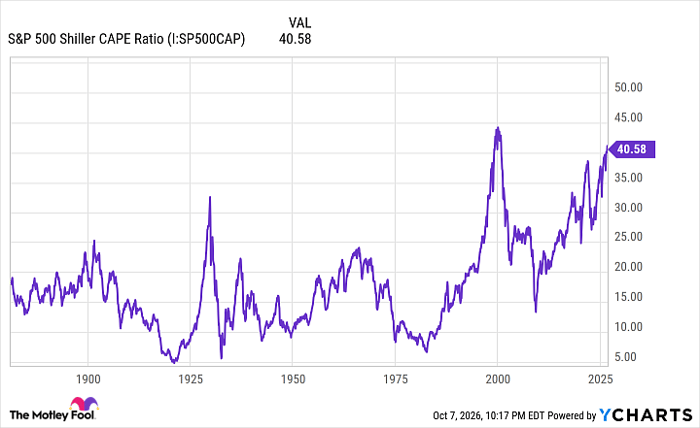
S&P 500 Shiller CAPE Ratio data by YCharts.
As of this writing, the Shiller CAPE ratio had reached 41.8. That's its second-highest level of all time, higher than any time since 1999. Does this mean stocks are due for a crash?
Not necessarily. No single valuation metric is 100% correct, and no way of looking at the stock market has a perfect track record of predicting the future. The S&P 500 moves up and down for all kinds of complex reasons.
The Shiller CAPE ratio is worth knowing about. But it doesn't mean you have to make big changes in your investment allocations. Let's see what the Shiller CAPE ratio could mean for your stock portfolio.

Image source: Getty Images.
Why the Shiller CAPE ratio matters (or not)
The Shiller CAPE ratio is well-respected by stock market analysts because it's a way to compare the S&P 500 index's valuation across long-term time frames. The CAPE ratio effectively "smooths out" the ups and downs of S&P 500 earnings due to changes in the business cycle, such as recessions, and adjusts company earnings per share for inflation.
However, there are a few reasons why the historical data-based approach of the CAPE ratio might not be the best way to predict future performance of the S&P 500 today. The CAPE ratio doesn't include stock buybacks. It also uses Generally Accepted Accounting Principles (GAAP) earnings, and GAAP standards have changed a lot since 1871. Another big limitation of the CAPE ratio is that it looks at S&P 500 performance during the past 10 years -- but today's stock prices are forward-looking, based on expectations of future earnings.
Should you keep buying the S&P 500 with a high CAPE ratio?
Ever since July 2009, the CAPE ratio has been higher than its long-term average of 17. But rather than delivering weak returns (which a high CAPE ratio would seem to suggest), the stock market has delivered strong returns during that time.
For example, in the past 16 years since September 2010, the Vanguard S&P 500 ETF (NYSEMKT: VOO) has delivered annualized returns of about 15%. That's much better than the S&P 500 long-term average of 10% annualized returns.
It's possible that the S&P 500 has reached a "new normal" regarding the CAPE ratio. Today's S&P 500 companies might just be more profitable and have stronger earnings potential compared to previous eras. The economy is a lot bigger than it was in 1871. 58% of Americans own stocks today, while in 1871, buying stocks was more of a pastime for only the richest people.
Is the Shiller CAPE ratio irrelevant or outdated? No. It can be a good tool, and it's worth watching. But don't assume that this one imperfect valuation method is 100% correct at predicting the future.
Should you buy stock in S&P 500 Index right now?
Before you buy stock in S&P 500 Index, consider this:
The Motley Fool Stock Advisor analyst team just identified what they believe are the 10 best stocks for investors to buy now… and S&P 500 Index wasn’t one of them. The 10 stocks that made the cut could produce monster returns in the coming years.
Consider when Netflix made this list on December 17, 2004... if you invested $1,000 at the time of our recommendation, you’d have $379,123!* Or when Nvidia made this list on April 15, 2005... if you invested $1,000 at the time of our recommendation, you’d have $1,408,822!*
Now, it’s worth noting Stock Advisor’s total average return is 950% — a market-crushing outperformance compared to 215% for the S&P 500. Don't miss the latest top 10 list, available with Stock Advisor, and join an investing community built by individual investors for individual investors.
See the 10 stocks »
*Stock Advisor returns as of October 12, 2026.
Ben Gran has no position in any of the stocks mentioned. The Motley Fool has positions in and recommends Vanguard S&P 500 ETF. The Motley Fool has a disclosure policy.
Recommended Articles


