




SpaceX Stock Price Prediction: Shares Rise 6% on $100 Billion Unlock Day; Has SPCX Slump Ended?
TradingKey - As of August 6, Eastern Time, SpaceX (SPCX) shares rose 6.14% to close at $114.92. Notably, approximately 911.5 million shares of SpaceX stock were unlocked and became eligible for trading that day, involving a scale exceeding $100 billion. Previously, there were widespread market concerns that a large number of employees and early investors might choose to cash out, increasing share supply and weighing on the stock price. However, the actual performance showed a rebound.
Prior to this, SPCX had continuously pulled back from its post-listing high of $225.64, dropping to a low of around $107, representing a decline of more than 50% from its historical high. With the lock-up expiration pressure behind it and the release of the company's latest financial results, will the downward trend of SPCX's stock price reverse?
Why SPCX Stock Is Rising
SpaceX's stock rose on its lock-up expiration day, primarily because actual selling pressure was lower than previous market expectations.
This lock-up expiration marks SpaceX's first large-scale share release since its listing, with approximately 911.5 million shares becoming tradable, significantly increasing the public float. Previously, due to investor concerns that insiders and early investors might sell off shares in a concentrated manner, SPCX's stock price had been falling continuously ahead of the expiration, with the market pricing in some of the risk of increased supply in advance.
In terms of market performance, the expected concentrated sell-off did not materialize on the expiration day. Reuters data showed that SpaceX's trading volume surged significantly after the lock-up expired, with intraday transaction volume exceeding $23 billion, making it one of the most active trading days since its listing, yet the stock price still maintained its gains.
This suggests that some investors may have adjusted their portfolios in advance, and the pressure from the lock-up expiration was released during the previous stock price correction. Investopedia noted that part of the selling pressure may have already been priced in prior to the expiration, resulting in a rebound rally as the dust settled on the bad news after the actual expiration.
SPCX Stock Price Technical Analysis
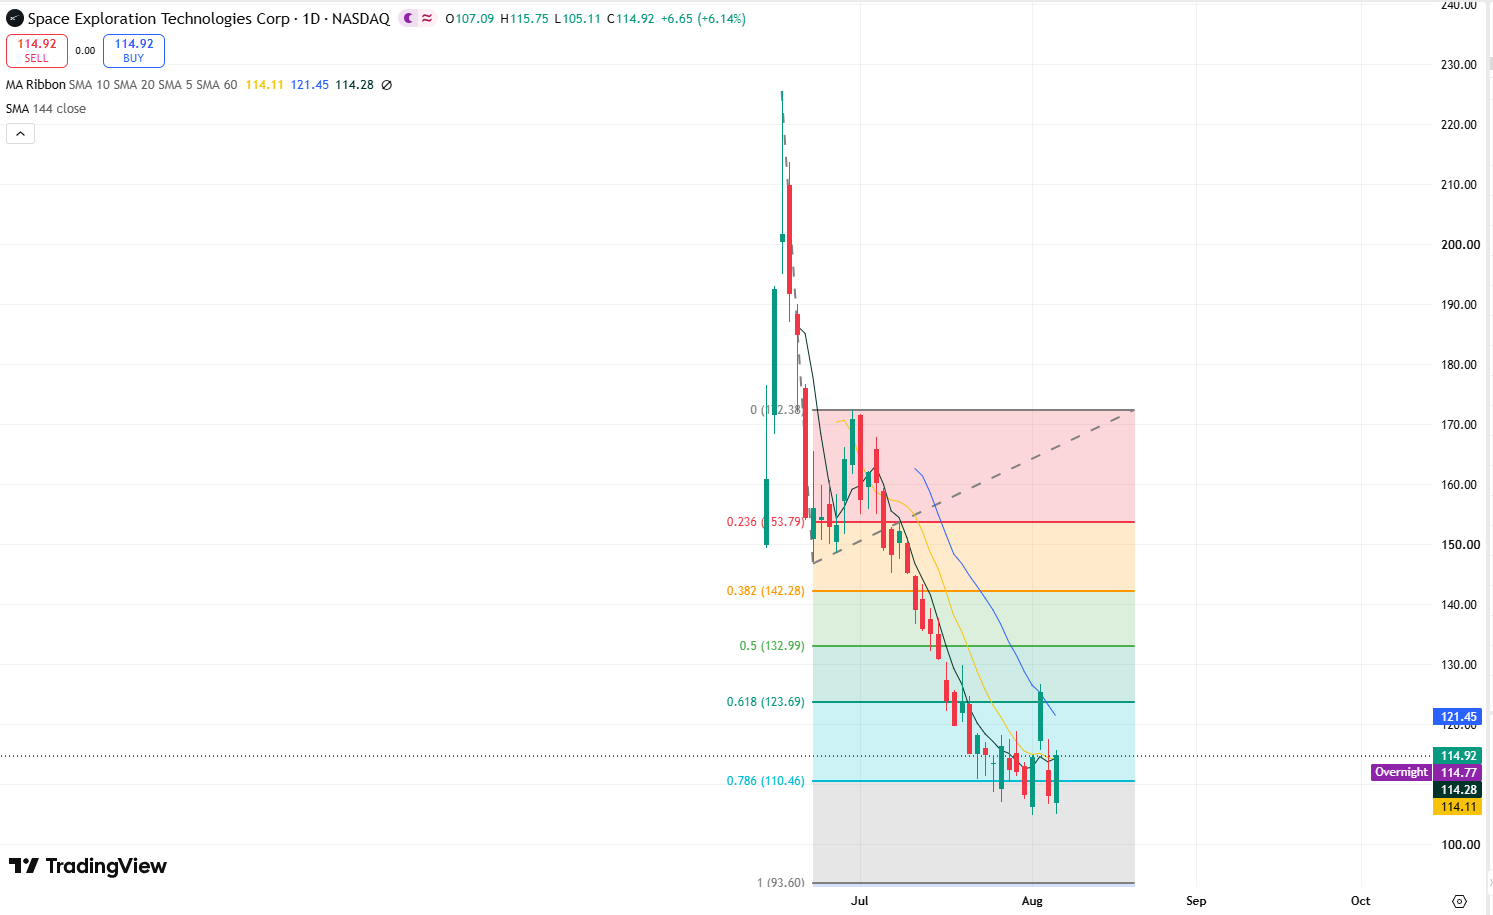
SPCX daily stock price chart, Source: TradingView
Looking at the daily chart of SPCX, the stock price has pulled back from its all-time high of $225.64 to around $105, with the candlestick pattern forming a clear downtrend. However, the stock price has recently tested the $105 support level twice in succession without breaking below it, indicating solid support at this level as short-term capital begins to re-enter the market.
On the downside, key support levels to watch are between $105 and $100. If the price breaks below the $100 mark, it could slide toward the $90 level. Conversely, if the stock can hold above the $100 mark, it suggests a short-term bottom has been established, paving the way for a technical recovery rebound.
On the upside, the immediate resistance to watch is the 20-day moving average near $121.50, followed by the recent rebound high of $126.71. A break above this level could pave the way for the stock to test the key resistance at $150. If the price breaks and holds above the $150 mark, the previous downtrend may be reversed.
Recommended Articles


