




The Bond Market Is Doing Something for the First Time in Nearly 20 Years. Here's What It Means for Investors.
Key Points
The 30-year Treasury yield touched 5.24% recently, marking its highest level since 2007.
The risk of the Fed raising interest rates this year and persistently high inflation are pressuring yields higher.
Treasury bills provide safety and yield as Treasury bonds stay volatile.
- 10 stocks we like better than iShares Trust - iShares 20+ Year Treasury Bond ETF ›
The 30-year Treasury yield touched 5.24% this past week before retreating slightly. It's the highest it's been in 20 years after the Federal Reserve left interest rates unchanged at its July meeting.
So far, it's been the culmination of a six-year bear market in long-duration Treasury bonds that started with the COVID market reversal in 2020, continued through an aggressive Fed rate hiking cycle, and is now reacting to persistently high inflation.
Where to invest $1,000 right now? Our analyst team just revealed what they believe are the 10 best stocks to buy right now, when you join Stock Advisor. See the stocks »
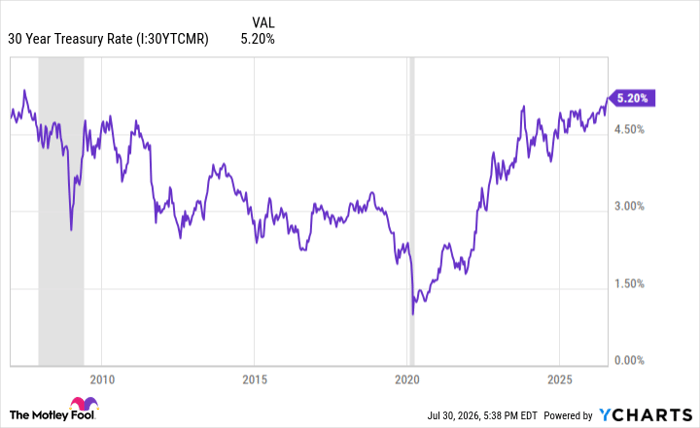
30 Year Treasury Rate data by YCharts
Why yields are spiking
The trigger for the recent yield spike was the Fed's rate decision. With oil prices rising and inflation risk high, there was some concern that the Fed would be too late to act again. With no immediate action by the Fed, the fear was that inflation rates and, by extension, long-term yields would have the catalyst to keep moving higher.
Three regional Fed presidents dissented in favor of a quarter-point hike instead, which was the first time since 2016 that three committee members went against consensus at the same time. The futures market is now pricing in a 65% chance of a hike at the September meeting and an 85% chance of at least one hike by the end of the year.
Image source: Getty Images.
Also contributing to the problem is new Fed chair Kevin Warsh's preference to provide less transparency going forward. Without more specific guidance on the future path of rates, the market has leaned toward selling Treasury bond positions.
How the Fed and inflation move the Treasury market
The Fed's benchmark rate essentially drives short-term borrowing costs and Treasury bill yields. But long-term Treasury yields respond more to macroeconomic conditions, including inflation expectations and future growth.
When inflation expectations rise, buyers demand a higher yield to compensate for the additional risk. That's largely what happened this past week. The two-year yield, which is often used as a proxy for Fed expectations, actually fell slightly as investors questioned how committed the committee was to raising rates. The 30-year yield, on the other hand, surged. This is called a bear steepening pattern, and it's often interpreted as the market believing the Fed is behind the curve in controlling inflation.
Another hot inflation report would likely push the 30-year yield even higher, since it essentially pulls forward hike expectations. A continued increase in oil prices probably does the same thing.
On the other hand, a weak jobs report, slowing wage growth, or a lower GDP reading could enhance the argument to hold steady. That could pull the 30-year yield back down toward the 5% level, but there are a lot of moving parts to consider.
What investors should do with this
For investors, the practical question is: What's the level of duration risk right now? Long-term Treasuries are very sensitive to changes in interest rates. Any move higher in yields could send long bond prices sharply lower. How low? The iShares 20+ Year Treasury Bond ETF (NASDAQ: TLT) is six years removed from its last all-time high and is still down more than 40% from that point.
That pressure is unlikely to ease if the Fed hikes one or more times over the next several months. Short-term Treasury bills and T-bill ETFs, however, could benefit. With only minor interest rate sensitivity, they can help protect against share price declines while quickly pricing in higher interest rates.
There's a reasonable case for trimming long-term Treasury exposure, although macro conditions and a potential flight-to-safety trade could have a lot to say about it. The bond market is risky, and there's been a fair amount of volatility over the past year. Regardless of what happens here, investors should remain cautious.
Should you buy stock in iShares Trust - iShares 20+ Year Treasury Bond ETF right now?
Before you buy stock in iShares Trust - iShares 20+ Year Treasury Bond ETF, consider this:
The Motley Fool Stock Advisor analyst team just identified what they believe are the 10 best stocks for investors to buy now… and iShares Trust - iShares 20+ Year Treasury Bond ETF wasn’t one of them. The 10 stocks that made the cut could produce monster returns in the coming years.
Consider when Netflix made this list on December 17, 2004... if you invested $1,000 at the time of our recommendation, you’d have $386,727!* Or when Nvidia made this list on April 15, 2005... if you invested $1,000 at the time of our recommendation, you’d have $1,232,139!*
Now, it’s worth noting Stock Advisor’s total average return is 906% — a market-crushing outperformance compared to 208% for the S&P 500. Don't miss the latest top 10 list, available with Stock Advisor, and join an investing community built by individual investors for individual investors.
See the 10 stocks »
*Stock Advisor returns as of August 2, 2026.
David Dierking has positions in iShares Trust-iShares 20+ Year Treasury Bond ETF. The Motley Fool has no position in any of the stocks mentioned. The Motley Fool has a disclosure policy.
Recommended Articles


