Solana Price Forecast: SOL risks a steeper decline below $70 despite steady ETF inflows

Source Fxstreet
  • Solana edges lower on Monday, facing downside pressure with the price capped below its 50-day EMA at $75.68.
  • Institutional demand shows resilience with five consecutive weekly inflows totaling $14.62 million in July.
  • Retail demand eases as trading volume declines and the funding rate turns negative. 

Solana (SOL) is trading in the red on Monday, losing bullish momentum and remaining capped below its 50-day Exponential Moving Average (EMA) at $75.68. SOL-focused Exchange Traded Funds (ETFs) show resilience with a monthly inflow of $14.62 million in July, while the near-term retail support wanes with the funding rate turning negative. The technical outlook for SOL is mildly bearish as downside momentum gains traction. 

Solana loses retail strength despite resilient ETF inflows

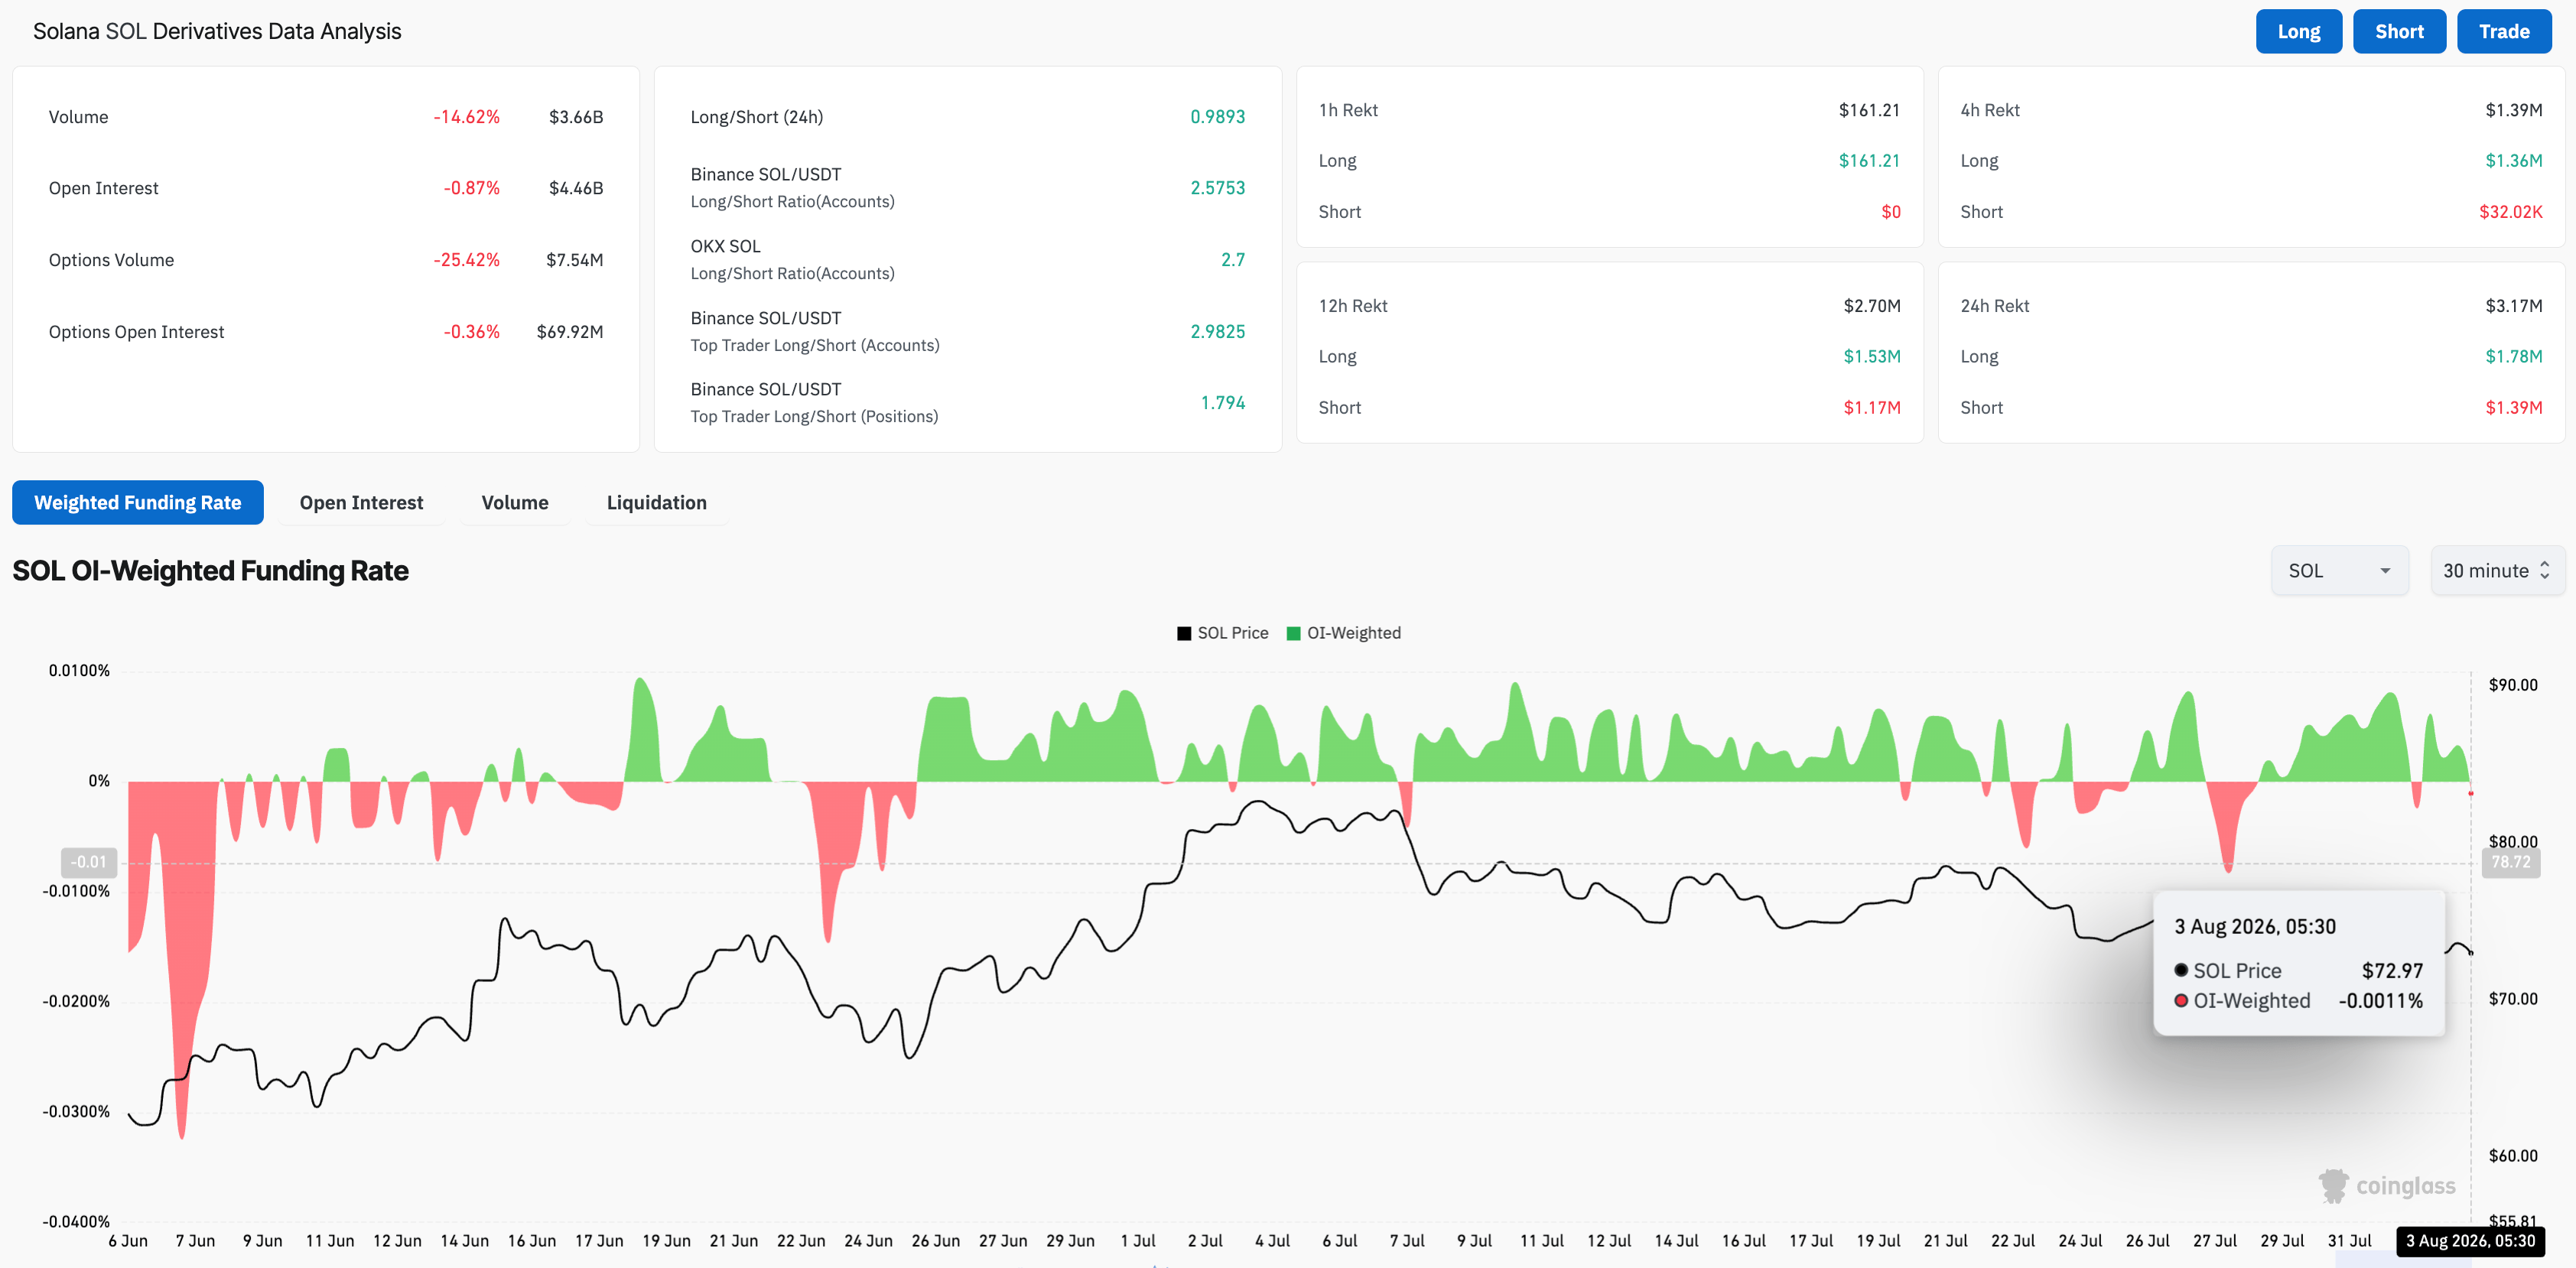
Solana is facing reduced speculative demand as broader crypto market sentiment weakens, while institutional investors remain resilient. CoinGlass data shows that SOL futures trading volume fell 14% over the last 24 hours to $3.66 billion, indicating reduced retail activity. Meanwhile, the funding rate – the premium traders are willing to pay to hold a position – has flipped negative to -0.0011% from a peak of 0.0062% on Sunday, pointing to a bearish bias. 

On the other hand, SOL ETFs recorded $2.82 million in inflows last week, extending a streak of five consecutive weekly inflows and bringing July inflows to $14.62 million. This marks the lowest monthly positive flow, up from $786,580 in outflows in May, which could be an early sign of renewed institutional demand. 
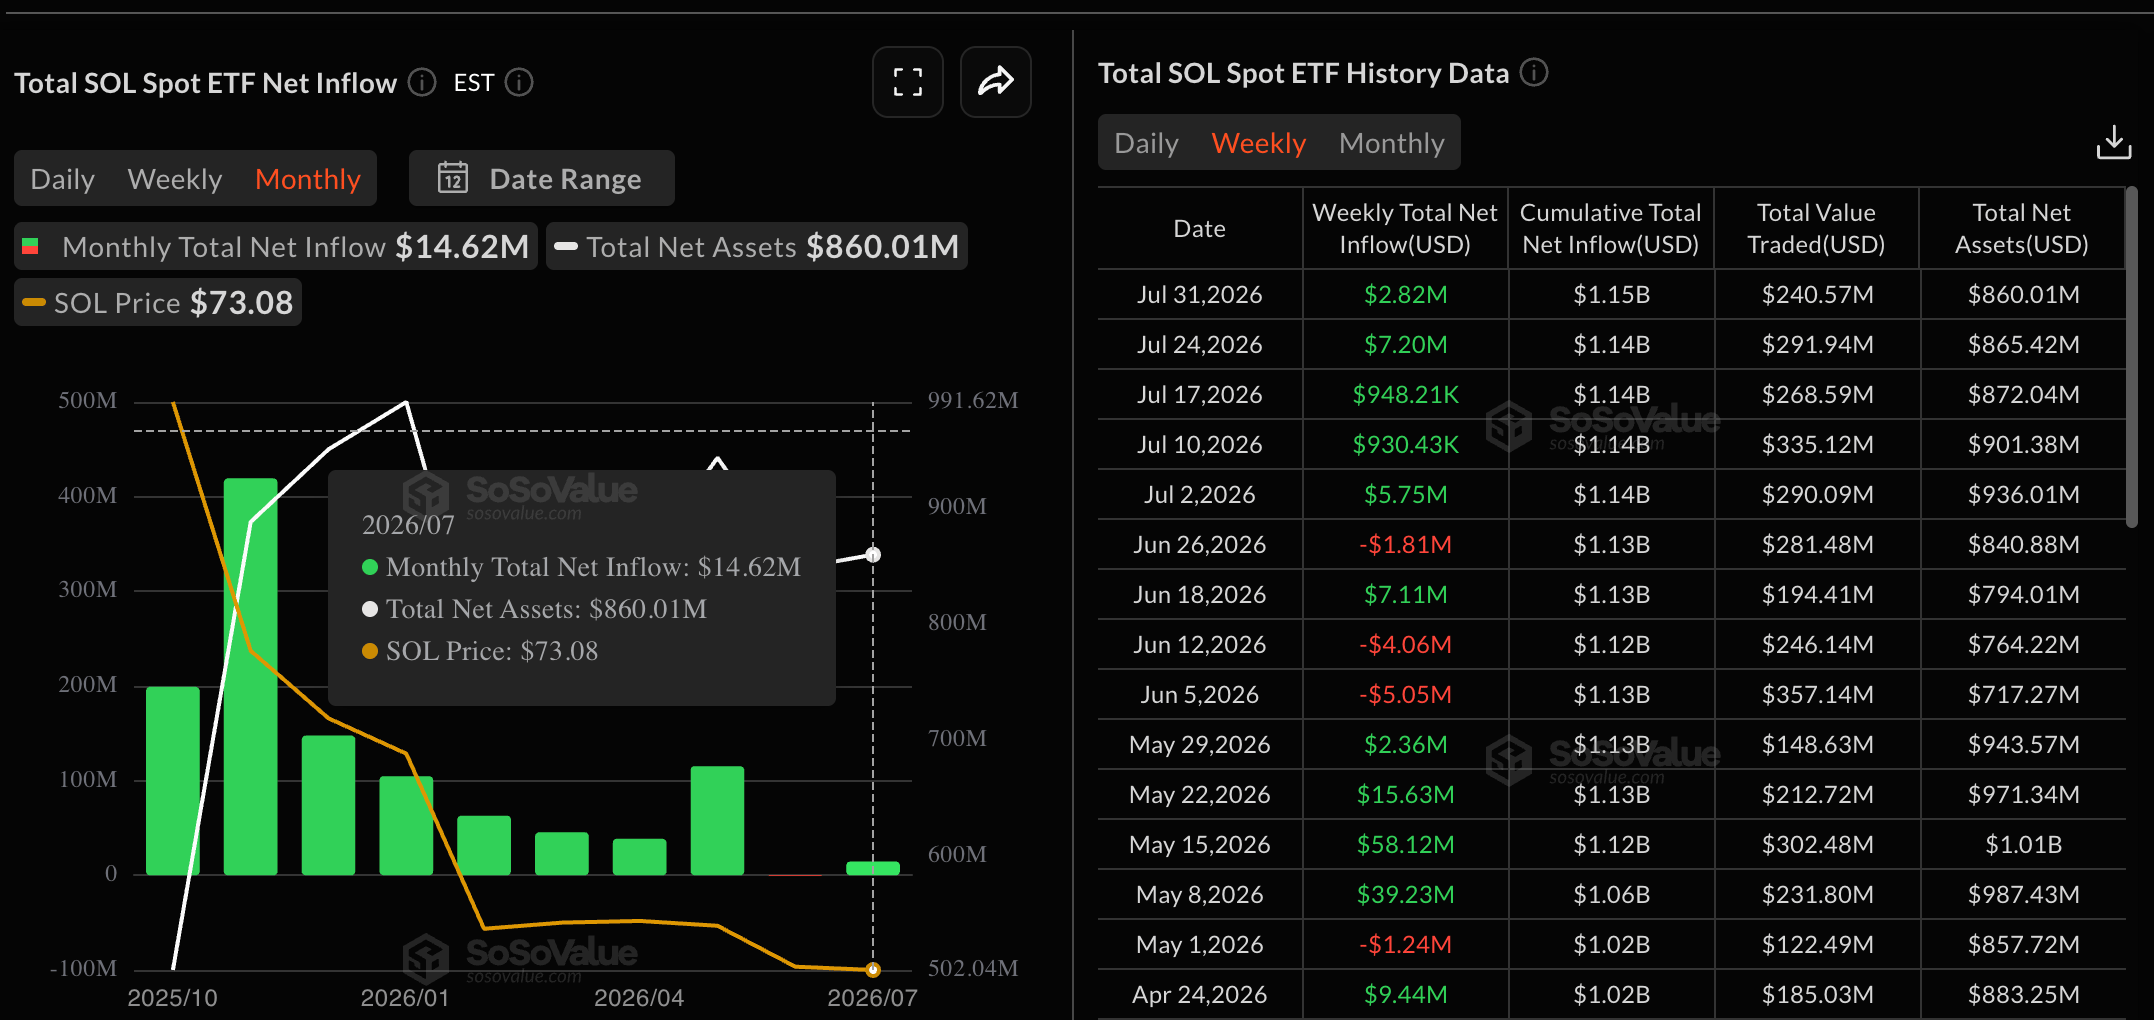
SOL ETFs data. Source: Sosovalue
SOL derivatives data. Source: CoinGlass

Technical outlook: Will Solana price drop below $70?

Solana maintains a bearish near-term tone, capped below its 50-day EMA at $75.68 and well under the 200-day EMA at $92.69. From a technical perspective, SOL trades below a descending trendline near $76.06 and is heading toward the support trendline near $71.30.

A decisive close below this zone could extend the decline toward the 78.6% Fibonacci retracement of the downswing from the $98.41 high to the $60.13 low, at $66.81

Momentum aligns with this capped structure, as the Relative Strength Index (RSI) at 43 hovers below the midline and the Moving Average Convergence Divergence (MACD) remains negative below the signal line, suggesting firm downside pressure.

Chart Analysis SOL/USDT (Binance)
SOL/USDT daily price chart.

On the topside, immediate resistance is clustered between the 50-day EMA at $75.68 and the trendline break level at $76.06. Further up, the 50% retracement at $79.27 defines a key barrier before the 23.6% retracement at $87.60 and the 200-day EMA at $92.69.

(The technical analysis of this story was written with the help of an AI tool. Know more.)

Disclaimer: For information purposes only. Past performance is not indicative of future results.
placeholder
Why are prediction market traders suddenly bearish on Nvidia's stock?Nvidia (NASDAQ: NVDA) stock is still green for 2026, but the trade no longer looks clean from the company that outperformed every other company and country in 2024 and 2025. NND is up about 12% this year, yet they have slipped roughly 3% over the past month. The gap with the rest of the chip...
Author  Cryptopolitan
Jun 23, Tue
Nvidia (NASDAQ: NVDA) stock is still green for 2026, but the trade no longer looks clean from the company that outperformed every other company and country in 2024 and 2025. NND is up about 12% this year, yet they have slipped roughly 3% over the past month. The gap with the rest of the chip...
placeholder
Gold Price Outlook For July 2026Gold trades near $4,140 on Tuesday, down 26% from January’s record high of $5,598 per ounce. This gold price prediction for July 2026 examines why the metal keeps falling and where it could bottom.Fiv
Author  Beincrypto
Jul 08, Wed
Gold trades near $4,140 on Tuesday, down 26% from January’s record high of $5,598 per ounce. This gold price prediction for July 2026 examines why the metal keeps falling and where it could bottom.Fiv
placeholder
Alphabet’s AI Chip Surprise Revives Bull Case for Beaten-Down Semiconductor StocksAlphabet (GOOGL) stock climbed about 3% on Monday. The trigger was a report from The Information that Google is building a new AI chip, called Frozen v2, to run its Gemini models up to 10 times more e
Author  Beincrypto
Jul 21, Tue
Alphabet (GOOGL) stock climbed about 3% on Monday. The trigger was a report from The Information that Google is building a new AI chip, called Frozen v2, to run its Gemini models up to 10 times more e
placeholder
What Crypto Whales Are Buying and Selling as August 2026 and the Fed Decision NearThe best altcoins for August could hinge on one event, the Federal Reserve’s July 29 rate decision, with a possible interest rate hike on the table. That catalyst reprices risk assets, and whale walle
Author  Beincrypto
Jul 29, Wed
The best altcoins for August could hinge on one event, the Federal Reserve’s July 29 rate decision, with a possible interest rate hike on the table. That catalyst reprices risk assets, and whale walle
placeholder
Shiba Inu Price Prediction for August 2026 as SHIB Turns 6 Years OldShiba Inu (SHIB) surged 28% last week before sellers rejected the rally at $0.00000548. The Shiba Inu price prediction for August 2026 now depends on the $0.00000446 support.Delayed Shibarium upgrades
Author  Beincrypto
Jul 31, Fri
Shiba Inu (SHIB) surged 28% last week before sellers rejected the rally at $0.00000548. The Shiba Inu price prediction for August 2026 now depends on the $0.00000446 support.Delayed Shibarium upgrades
Related Instrument
goTop
quote