




Costco Stock Price Forecast: High Valuation Meets Slowing Sales Growth, Can It Return to $1,000 in July?
TradingKey - As of July 10 ET, Costco ( COST) last stood at $912.97, down 4.21% on July 9 and up slightly by 0.22% in premarket trading. The stock price fell as the newly released June sales data showed a slowdown in growth.
Why Is Costco Stock Falling?
The primary driver behind the decline in Costco's share price is that its newly released June sales growth slowed compared to May.
According to the latest sales data, Costco's net sales for the retail month of June were $29.24 billion, up 10.6% year-on-year; cumulative net sales for the first 44 weeks were $250.43 billion, up 10.1% year-on-year. Looking at absolute growth alone, June sales data remained strong. Compared with May, when net sales grew 14.5% year-on-year and total comparable sales rose 12.5%, June's total comparable sales growth slowed to 8.8%. Excluding the impacts of gasoline prices and foreign exchange, total comparable sales in June grew 7.0%, which was also lower than May's 8.0%. This indicates that while sales resilience remains, the growth rate has slowed down.
However, the market's short-term focus is on the "gap in expectations." Costco has long been regarded as a high-quality consumer leader, and its valuation has consistently remained higher than that of traditional retailers. Currently, the company's P/E ratio is close to 46x, meaning that investors have already paid a high premium for its stable growth and defensive attributes. At this valuation level, the market has low tolerance for any slowdown in sales growth. As long as monthly sales growth retreats from high levels, even if absolute growth remains decent, it can easily trigger profit-taking.
In the medium to long term, Costco still possesses a strong moat. The company has a massive membership base, strong bargaining power in the supply chain, stable cash flow, and excellent inventory turnover efficiency. Membership fee income is an important source of its earnings quality, and its low-price strategy remains attractive during periods of economic uncertainty. However, whether the stock price can stabilize in the short term depends on whether the subsequent sales data for July and August can prove that the June slowdown was merely a temporary fluctuation, rather than the start of a weakening consumer trend.
Costco Stock Price Trend Analysis: Short-Term Support Near $890, July Stock Price Expected to Return Above $1,000
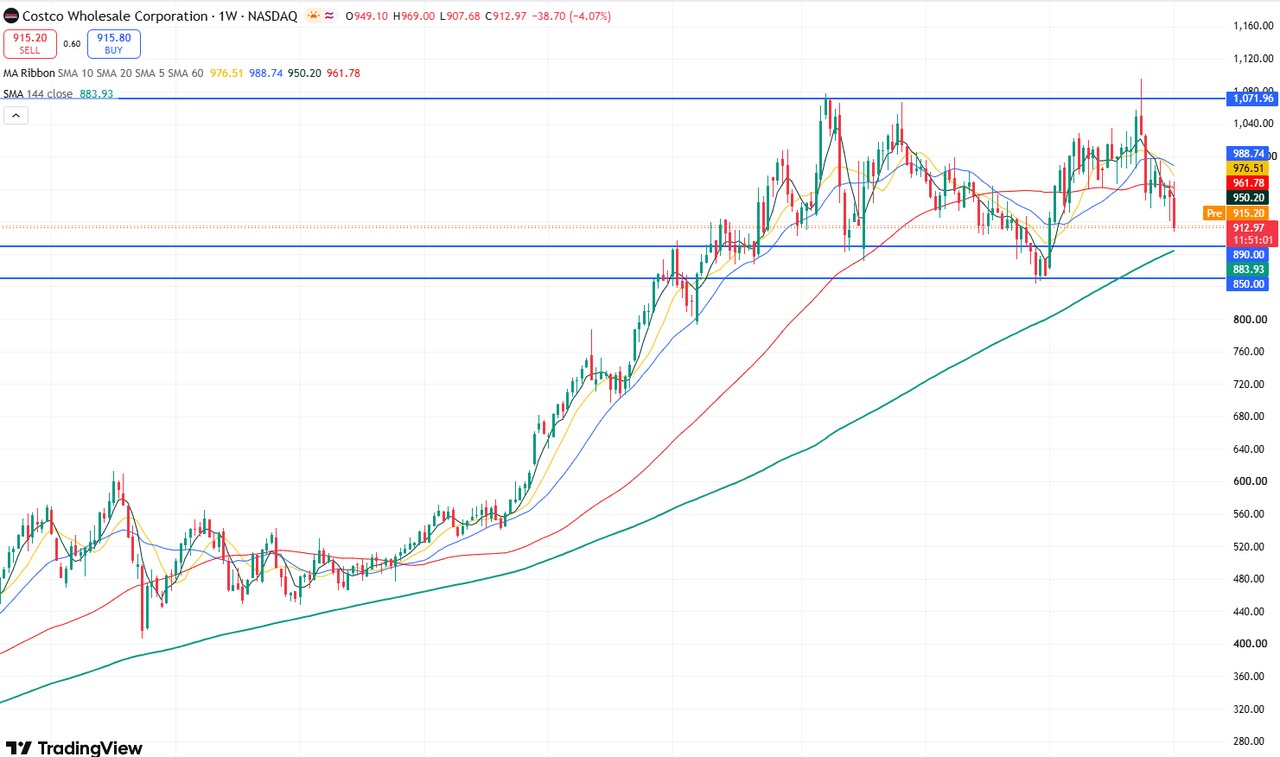
Costco stock price weekly chart, Source: TradingView
Looking at the weekly chart of Costco's stock price, the stock is in a clear high-level range-bound phase, with a trading range of $1,070-$850. The stock has tested the resistance level near $1,070 upward for three consecutive times, all of which failed to break through. Although the stock hit an all-time high of $1,096.50 in May, the closing price for that week was still below $1,070, indicating heavy resistance at this level.
At present, after falling below the SMA60 twice consecutively, short-term market sentiment may have turned bearish, and the stock price may continue to pull back in the short term. The primary support to watch below is $890, which is also near the SMA144, potentially forming a confluence of support. If it continues to decline, it may test the support level at $850.
If the stock price holds above $890 and the SMA144, it may undergo a short-term technical rebound, with the primary target testing the resistance range of $950-$1,000. If the stock breaks through and stabilizes above $1,000, it could even test the $1,100 mark further up.
Recommended Articles


