




Zcash Price Forecast: Bullish reversal in ZEC eyes $1,698 peak on NU7 upgrade
- Zcash hovers above $1,250 on Wednesday after a 9% surge the previous day, signaling a bullish turnaround.
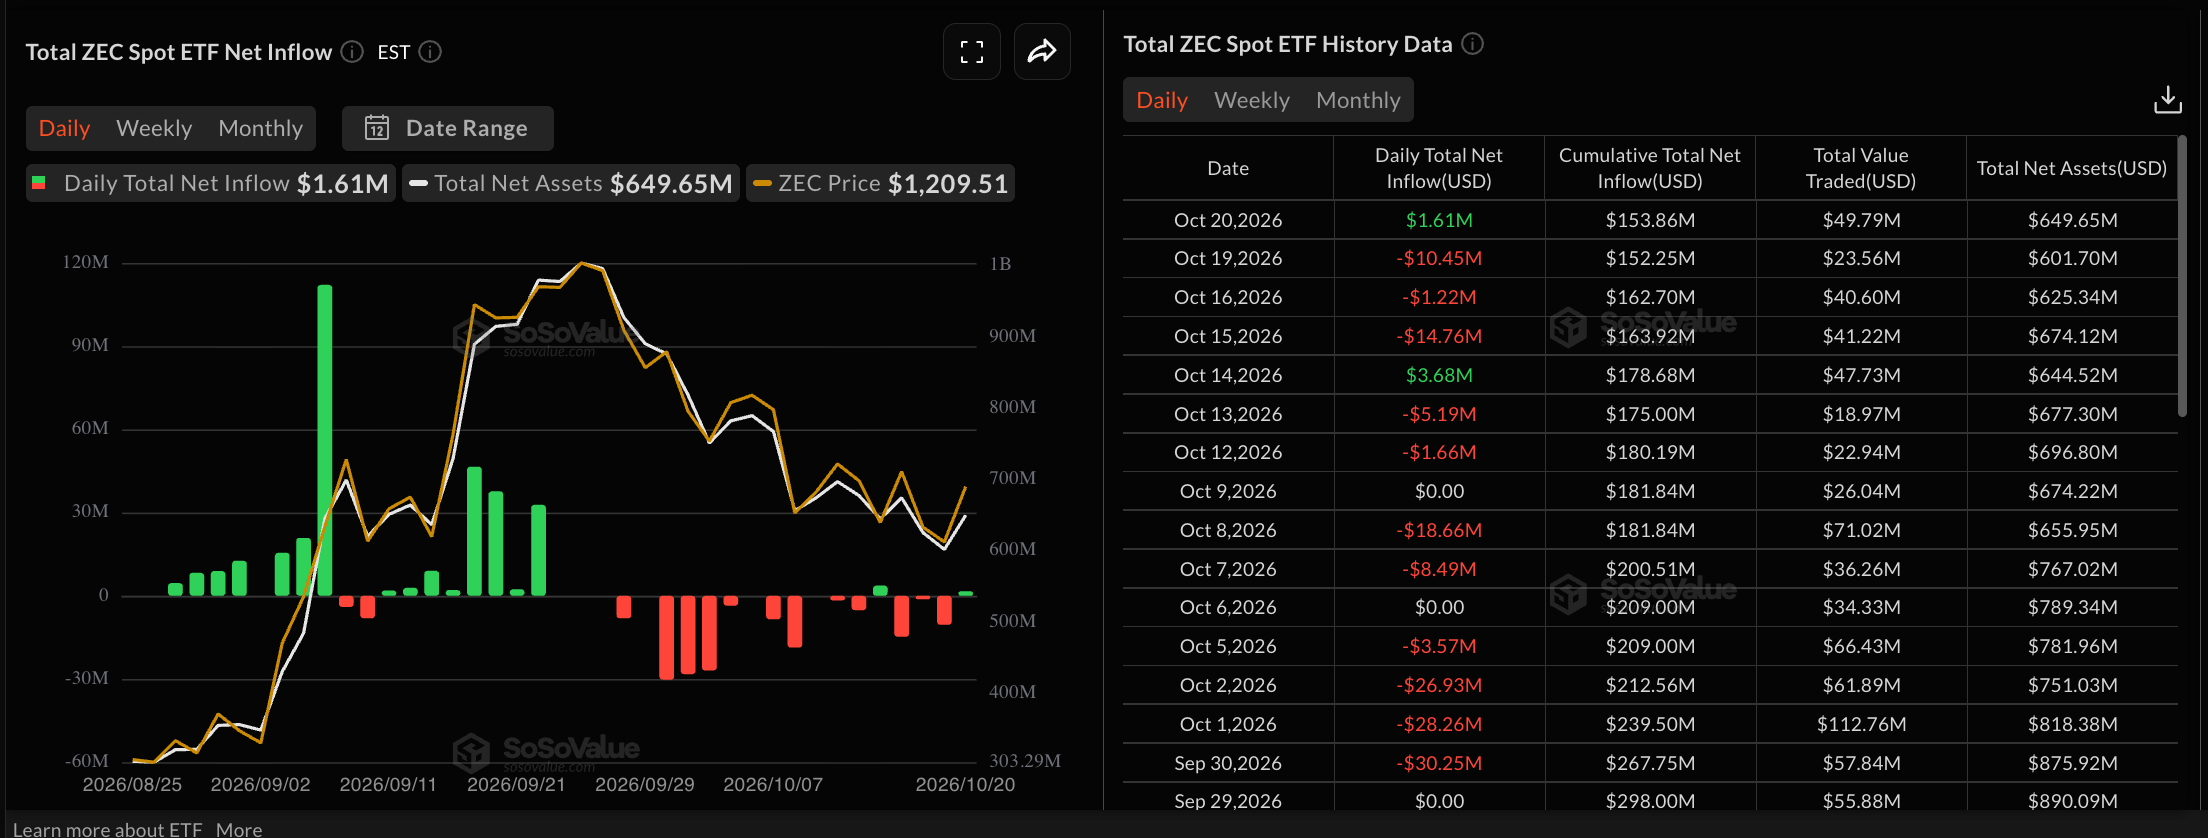
- Zcash ETF recorded over $1 million in inflows on Tuesday, suggesting reduced selling pressure after Monday’s $10 million outflow.
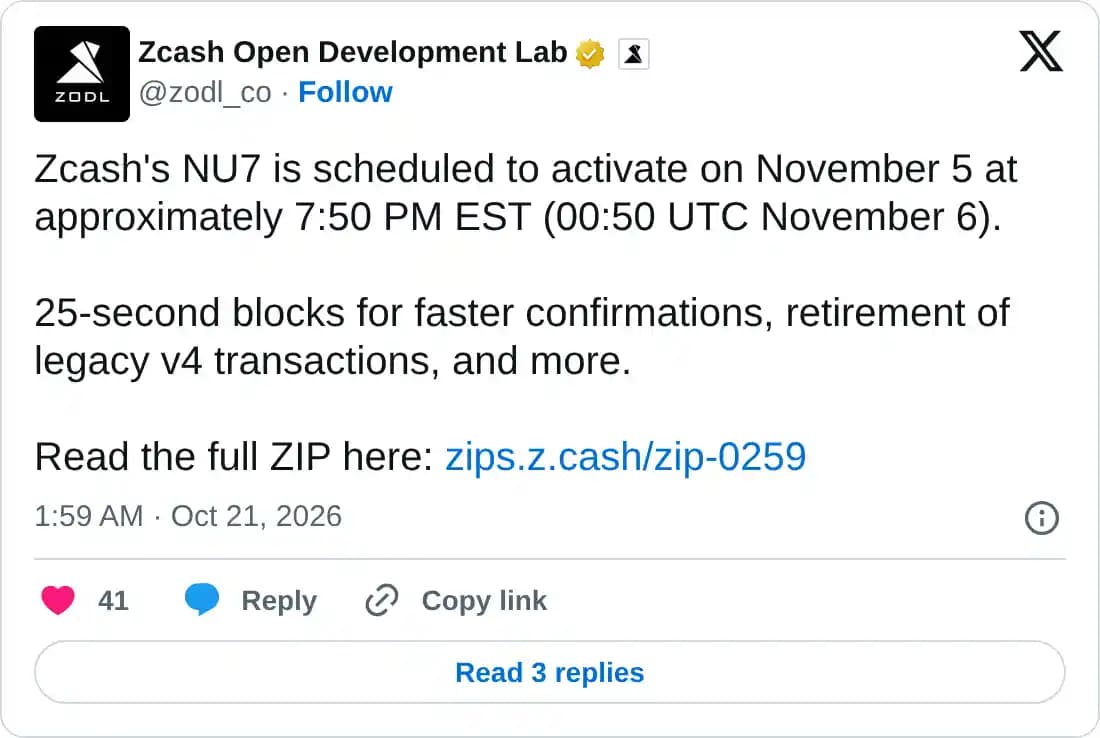
- Zcash's NU7 final mainnet activation is scheduled for November 6, reducing block confirmation time to 25 seconds.
Zcash (ZEC) shows signs of bullish recovery above $1,200 on Wednesday, following a 9% rebound the previous day linked to the upcoming NU7 upgrade. Blockworks released a Zcash holders report on Tuesday, highlighting steady network growth. The technical outlook for ZEC is bullish, with bulls eyeing an extended rally toward $1,698.
Institutional selling eases ahead of NU7 upgrade
Zcash Open Development Lab announced the final mainnet activation decision of the NU7 upgrade scheduled for November 6 at 00:50 GMT. The upgrade focuses on reducing block confirmation time from 75 seconds to 25 seconds, improving transaction speed by 3x, retiring the legacy v4 transaction pool, which suspends the ZEC tokens held in the Sprout shielded pool, and introducing the Network Sustainability Mechanism (NSM) that allocates 60% of the fees to the NSM Value Balance and directs the rest to miners.
Institutional investors remain under pressure after three consecutive weeks of strong sell-off. SoSoValue data shows the Bitwise’s ZEC-focused Exchange Traded Fund (ETF) recorded $1.61 million in inflows on Tuesday, indicating a near-term positive shift from Monday’s $10.45 million outflows. The weekly trend shows a sharp decline in total outflows from $93.56 million in early October to $19.15 million last week, suggesting that institutional investors are easing selling pressure.
On the other hand, Blockworks data show that network transactions climbed 21% to roughly 710,000 over the last three months, with over half of them non-shielded. In addition, the network’s Real Economic Value (REV) rose by almost 85% to $204,000.

Technical outlook: Will Zcash price rally back toward $1,700?
Zcash trades at $1,260 at press time on Wednesday, extending a bullish near-term bias. On the four-hour chart, ZEC holds above both the 50- and 200-period Exponential Moving Averages (EMAs) at $1,181 and $1,230, respectively.
The 9% rebound from the previous day breaks above the downward-sloping resistance trendline, which now acts as support around $1,183, reinforcing an upside-skewed structure. Zcash now pushes against the $1,296 horizontal level set by the September 9 high, where a confirmed breakout could extend the rally to the $1,698 peak from September 26.
The Relative Strength Index (RSI) is near 65 on the four-hour chart, while the Moving Average Convergence Divergence (MACD) line holds a positive upward trend, hinting at persistent buying pressure rather than exhaustion.
On the downside, immediate support is seen at the 200-period EMA at $1,230, followed by a structural zone defined by the former resistance trend-line break near $1,183 and the 50-period EMA at $1,181.
(The technical analysis of this story was written with the help of an AI tool. Know more.)
Recommended Articles


