




Uniswap Price Forecast: UNI risks steeper decline as bearish signals pile up
- Uniswap is down nearly 6% on Wednesday, extending a 5% loss from the previous day.
- Uniswap rolls out Continuous Clearing Auctions on Avalanche, enabling teams to run on-chain token auctions and bootstrap liquidity.
- Data shows declining retail demand and social interest in Uniswap, pointing to risk-off sentiment among traders.
Uniswap (UNI) faces intense selling pressure, down nearly 6% on Wednesday after a 5% drop the previous day. The launch of Continuous Clearing Auctions on Avalanche enables teams to run on-chain token auctions and bootstrap liquidity, reducing friction in interoperability. Still, retail support is on a downhill with declining Open Interest and Social Dominance, implying risk-off sentiment among traders.
Uniswap retail interest flips bearish
Uniswap continues to roll out new features with Continuous Clearing Auctions on Avalanche, following the recent launch of the TradePools launchpad on Robinhood, and offering yield on USDC, USDT, or ETH deposits. The auctions will allow Avalanche developers to deploy fully on-chain token auctions and tap bootstrap liquidity on Uniswap v4.
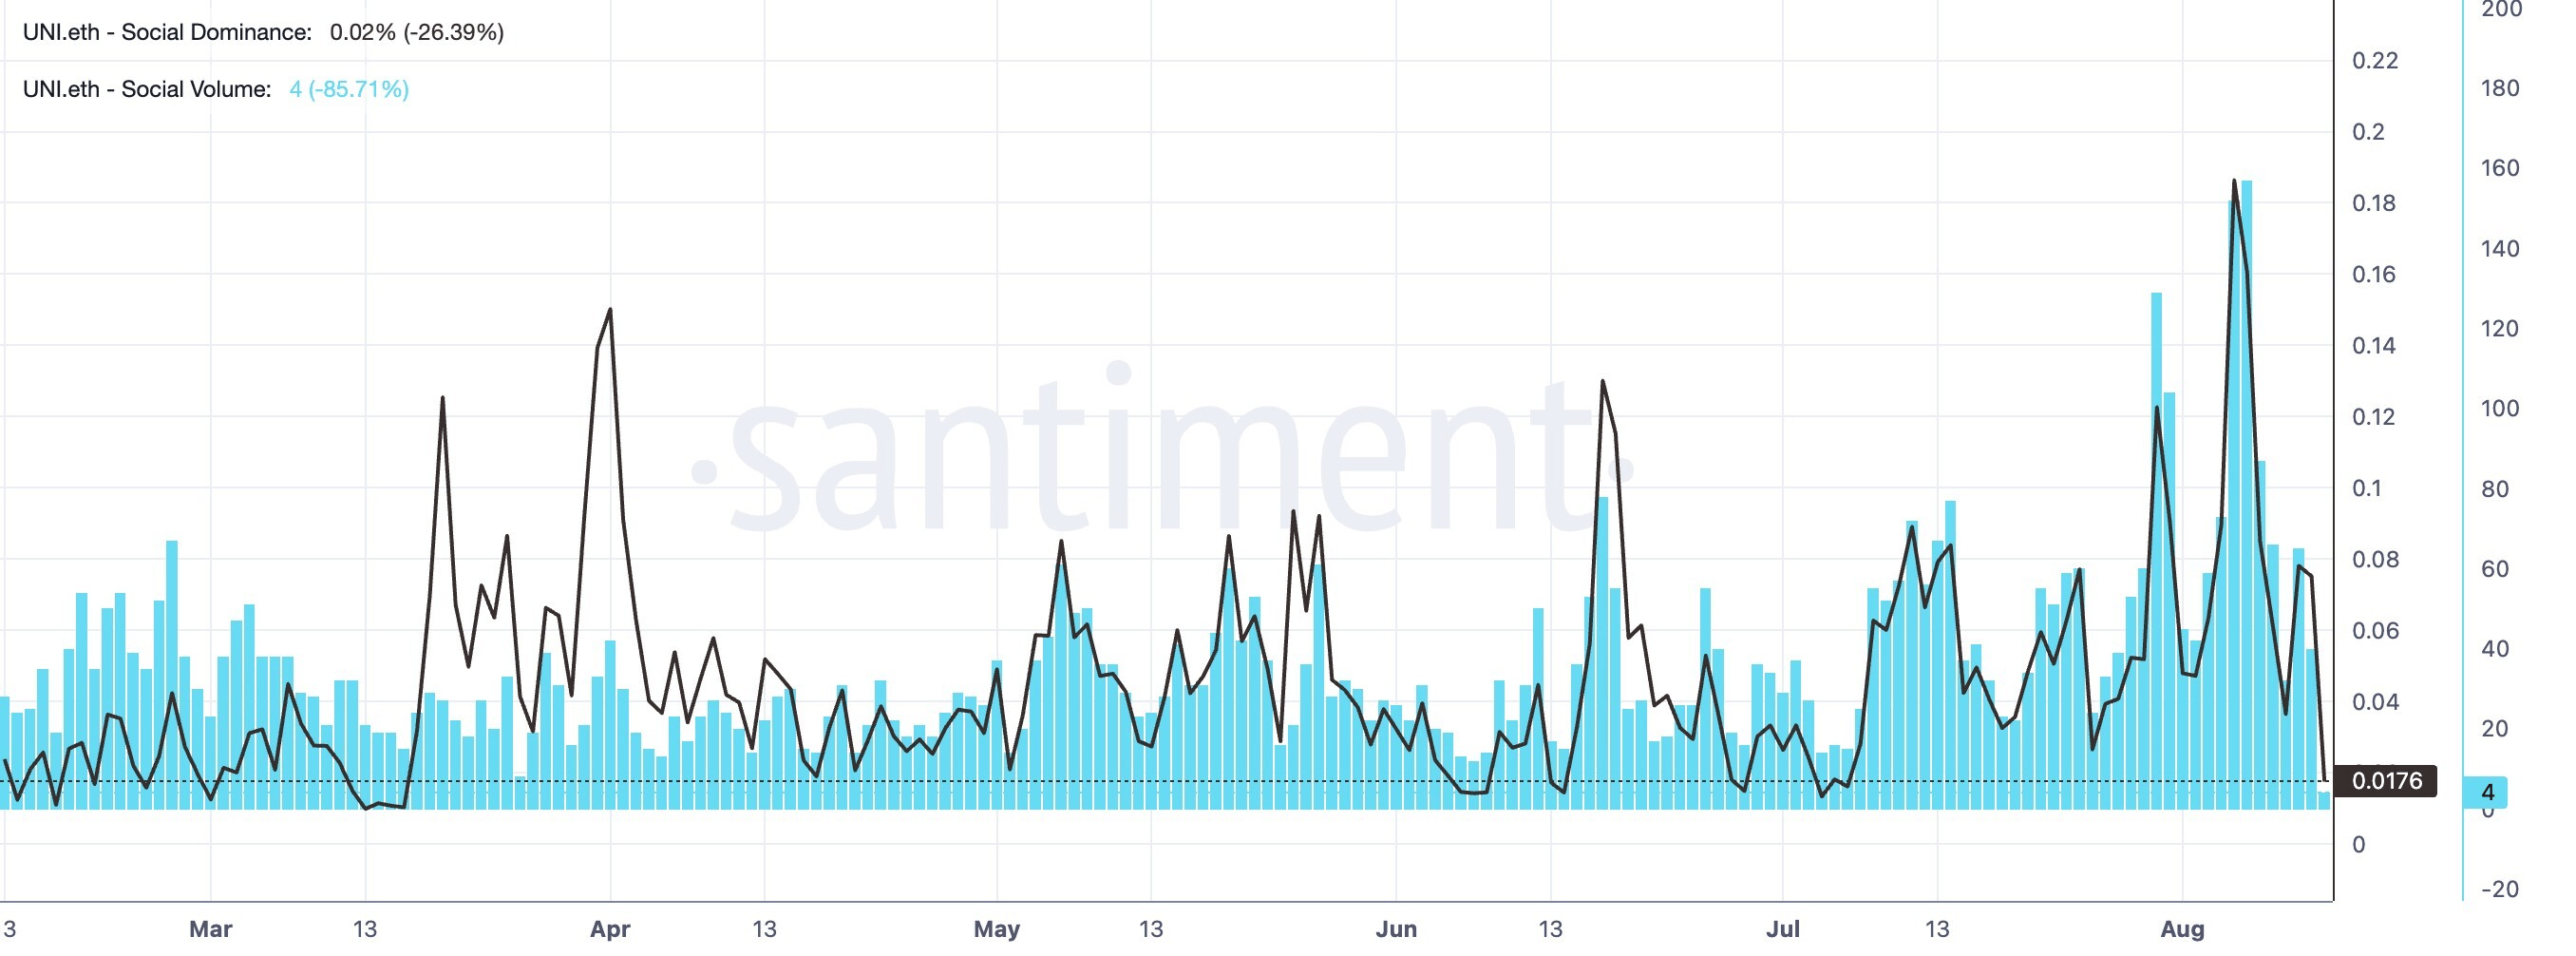
Despite new features, Uniswap is losing retail strength, likely linked to the risk-averse sentiment in the crypto market ahead of the US Consumer Price Index (CPI) for July, scheduled for Wednesday around 12:30 GMT. Santiment data shows Social dominance and volume dropped to 0.08% and 40 on Tuesday, from 0.19% and 152, indicating a sharp decline in retail buzz.
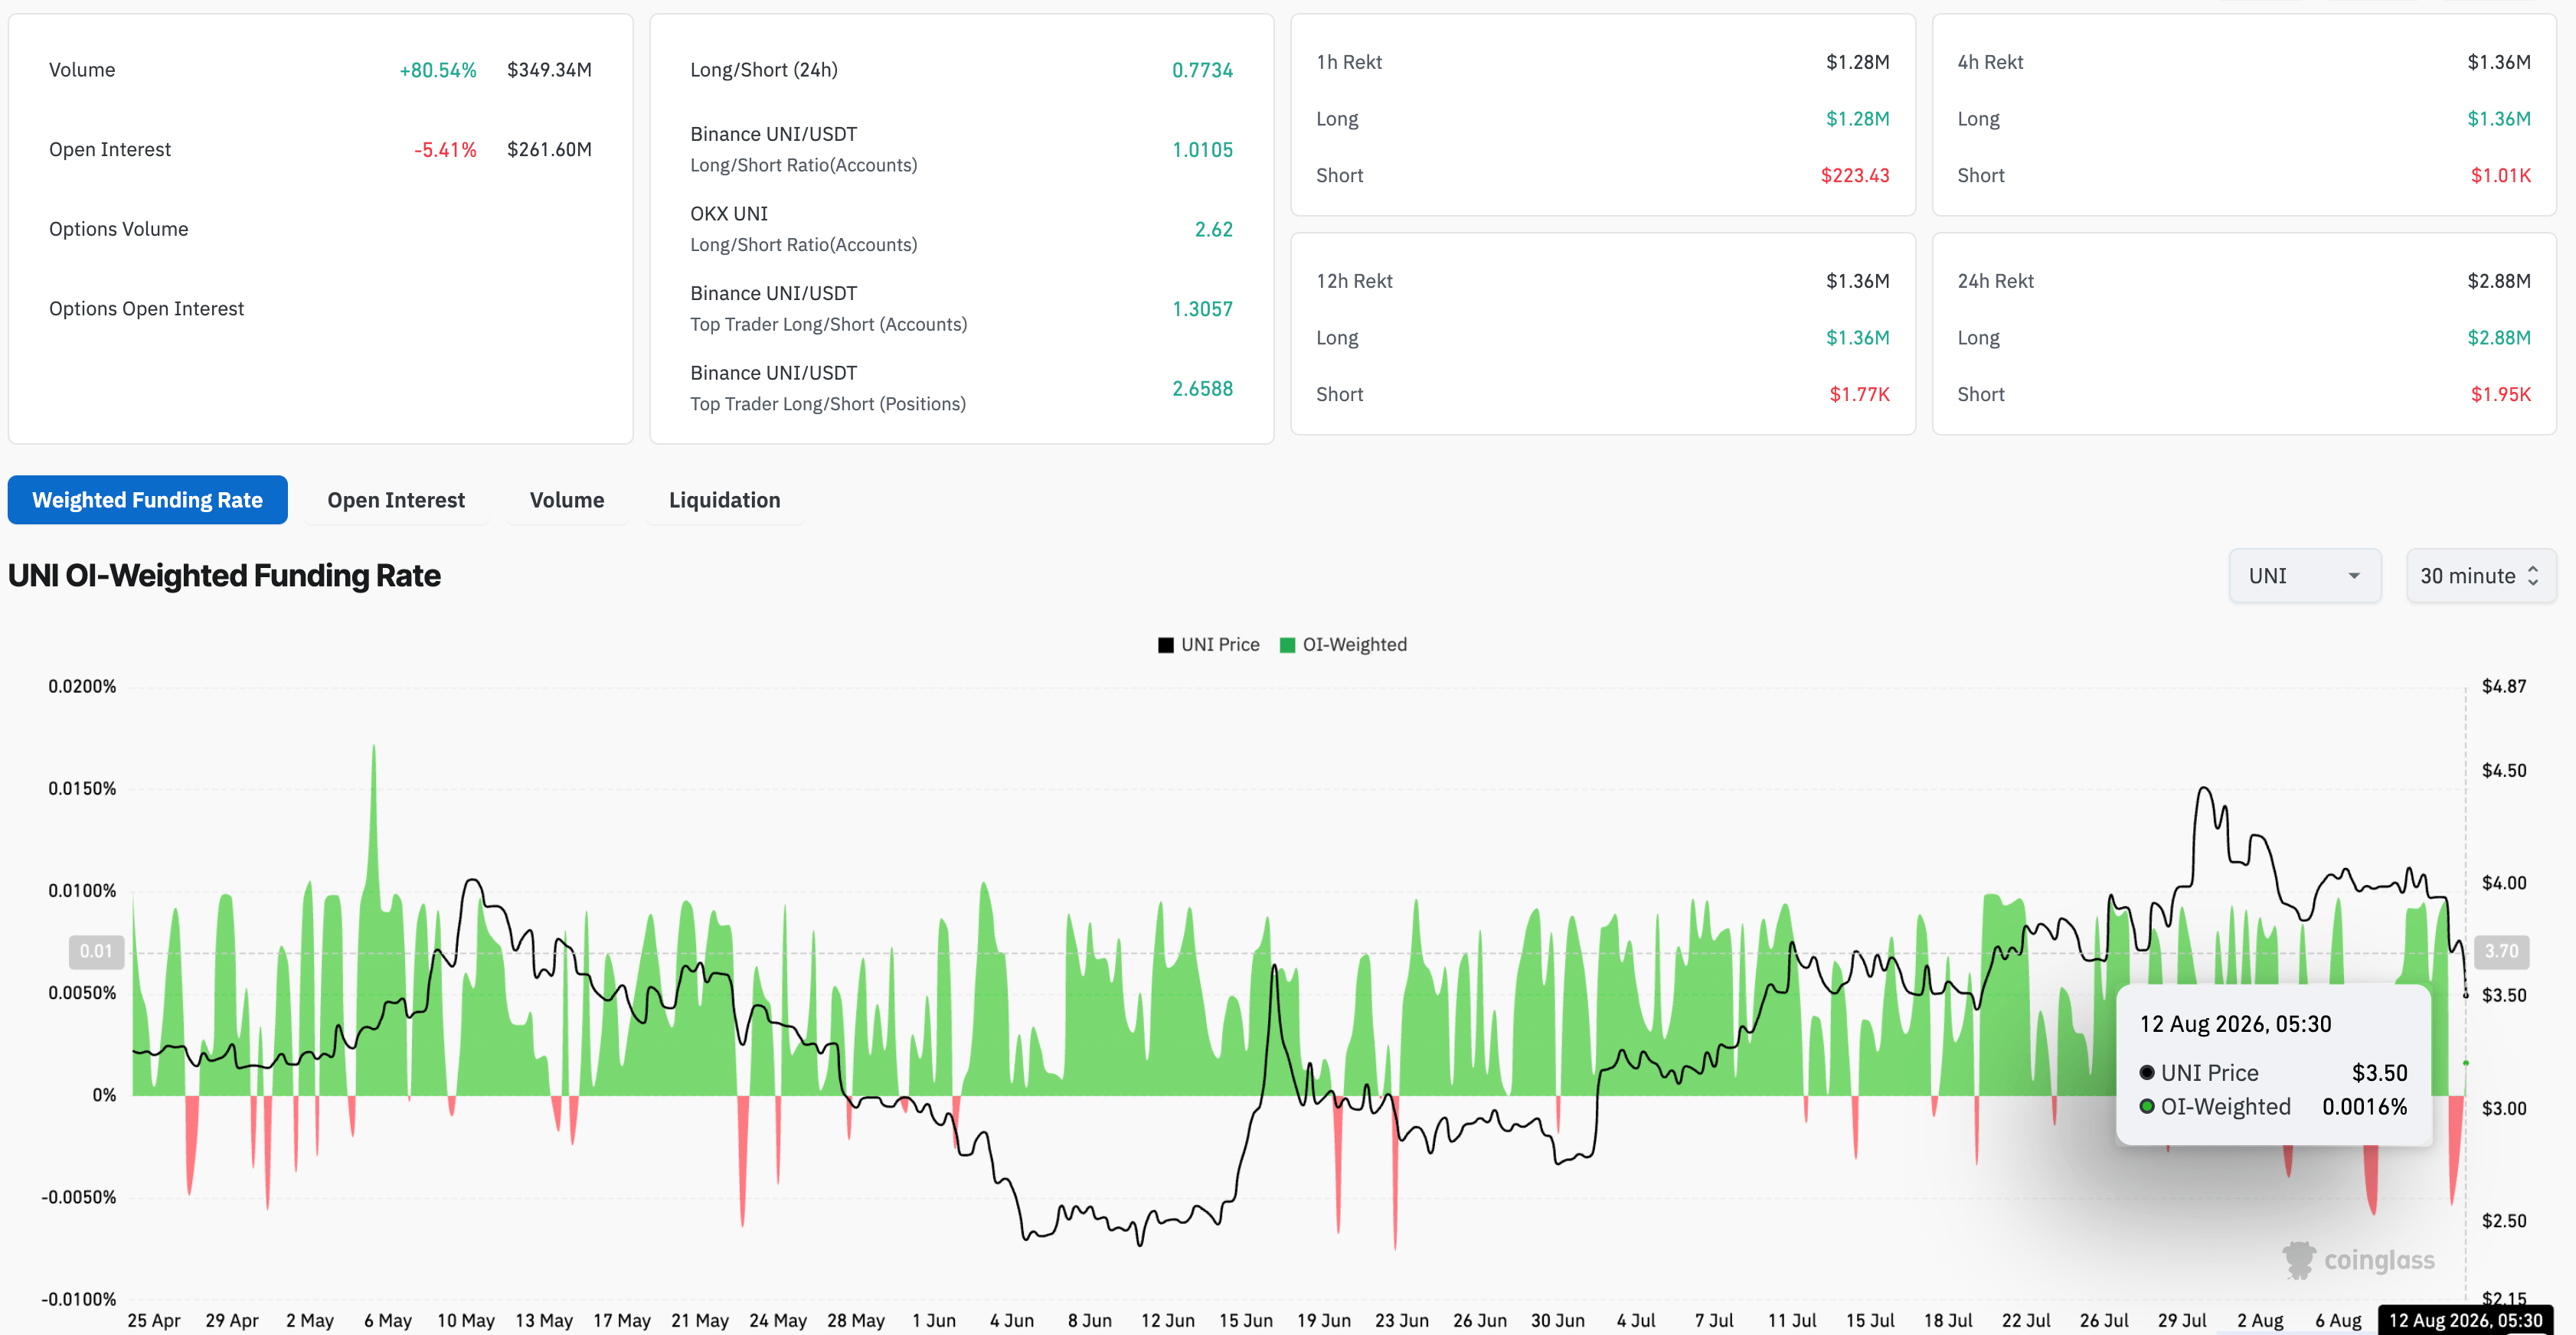
Corroborating with the declining retail strength, CoinGlass data shows the UNI futures Open Interest is down over 5% in the last 24 hours to $261.60 million, implying a contraction in the notional value of active contracts. Long liquidation of $2.88 million outpaced short liquidation of $1,950 in the same time period, pointing to a biased wipeout of bullish positions. Still, the OI-weighted funding rate of 0.0016%, up from -0.0054% the previous day, reflects mixed sentiment among traders.
Technical outlook: Will Uniswap lose its 100-day EMA at $3.55?
Uniswap extends losses on Wednesday, testing its 100-day Exponential Moving Average (EMA) at $3.55. UNI trades below the 50-day and 200-day EMAs at $3.65 and $3.93, respectively, which reinforces overhead supply.
Momentum aligns with this defensive tone, with the Relative Strength Index (RSI) at 40 edging toward bearish territory and the Moving Average Convergence Divergence (MACD) falling below its signal line with an expanding bearish profile, hinting at persistent downside pressure.
A decisive close below the 100-day EMA at $3.55 could target the 50% retracement, measured from $2.31 to $4.57, at $3.25.
On the topside, immediate resistance is defined by the 50-day EMA at $3.65, followed by the cluster of 23.6% Fibonacci retracement at $3.89 and the 200-day EMA at $3.93.
(The technical analysis of this story was written with the help of an AI tool. Know more.)
Recommended Articles


