




Ripple and Stellar outlook: Mixed signals leave XRP and XLM at crossroads
- XRP extends its recovery slightly on Thursday, holding above its key $1 support zone.
- XLM hovers around the key support at $0.173, with a break below risking deeper losses.
- Mixed derivatives signals keep the outlook uncertain for both altcoins.
Ripple (XRP) and Stellar (XLM) are trading at critical technical levels on Thursday. XRP has stabilized above the psychological $1.00 support, while XLM is testing support at $0.173. Traders should be cautious as mixed derivatives metrics keep the outlook uncertain for both altcoins.
Mixed sentiment among traders
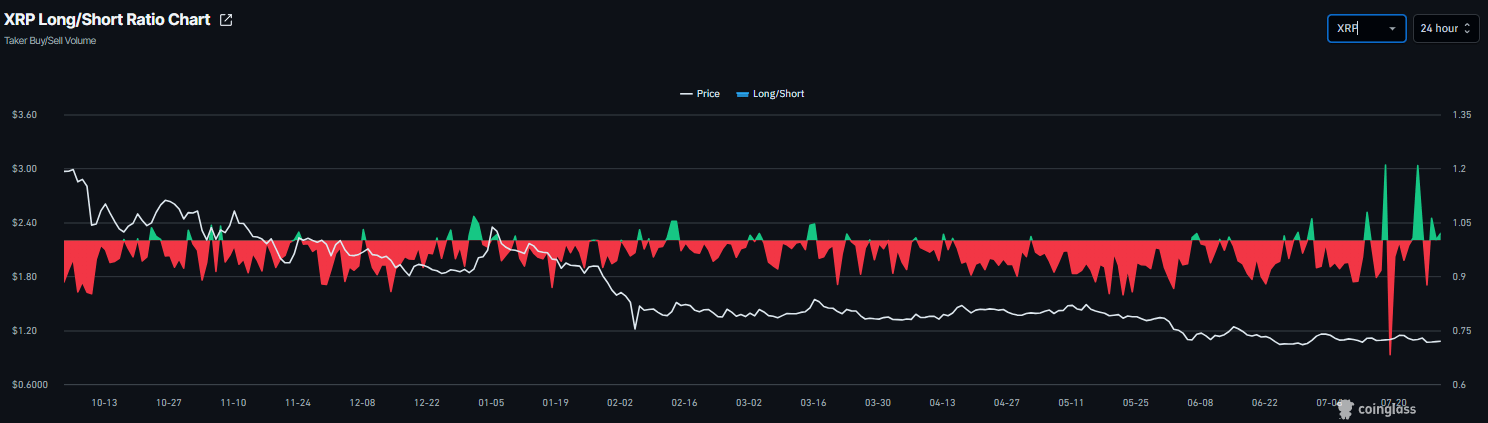
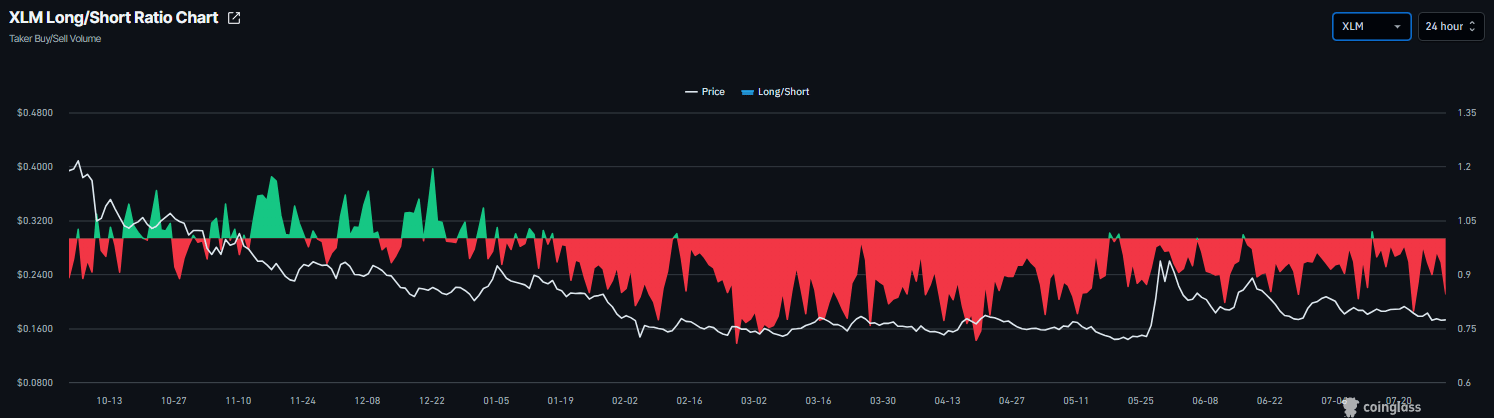
Derivatives data shows mixed sentiment among traders. CoinGlass’ long-to-short ratio for XRP reads 1.02 on Thursday. A ratio above one indicates bullish sentiment, as traders are betting the asset price will rise. Meanwhile, XLM's ratio has dropped to 0.84, near a one-month low, indicating traders are increasingly betting on further downside.
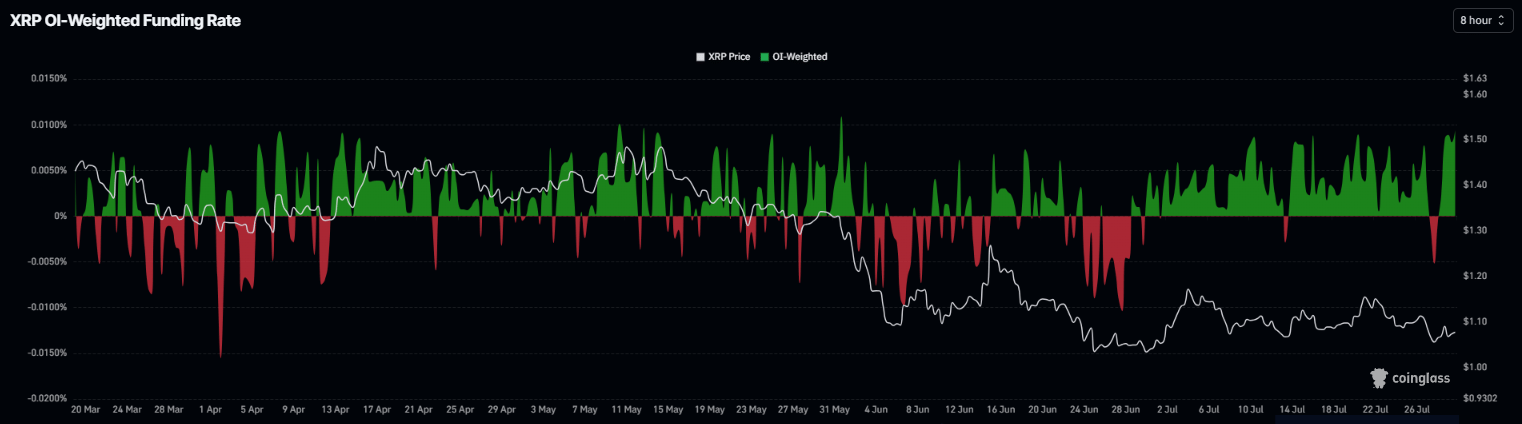
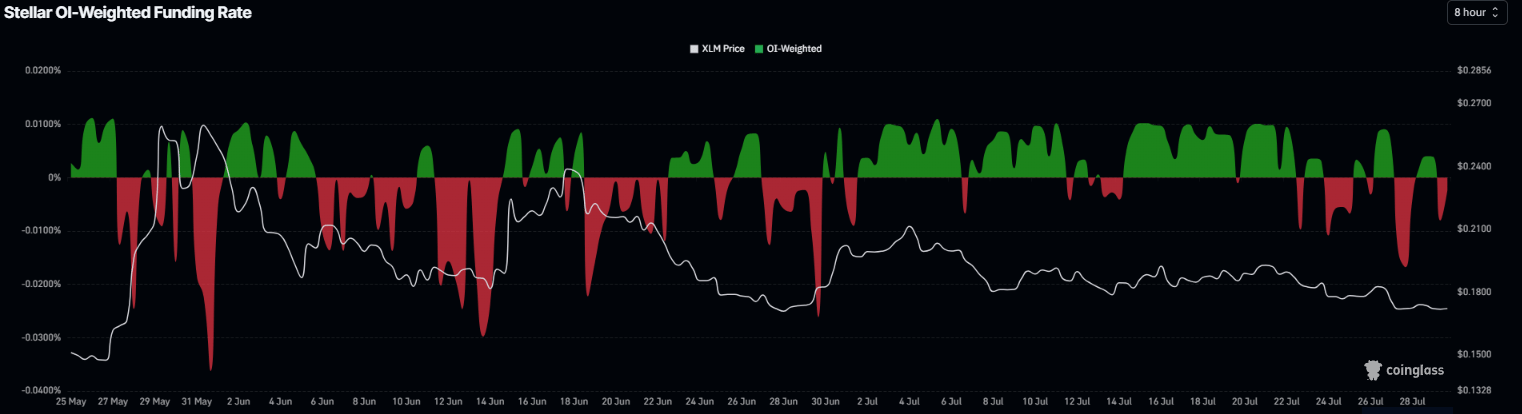
Funding rate data also points to diverging sentiment between XRP and XLM. XRP funding rates flipped positive on Tuesday, reading 0.0094% on Thursday, indicating that long traders are paying shorts and reflecting a bullish bias. In contrast, for XLM, the funding rate flipped negative on Wednesday, reading -0.0024%, indicating that shorts are paying longs and signaling bearish sentiment.
XRP technical outlook: Holds above key $1 support
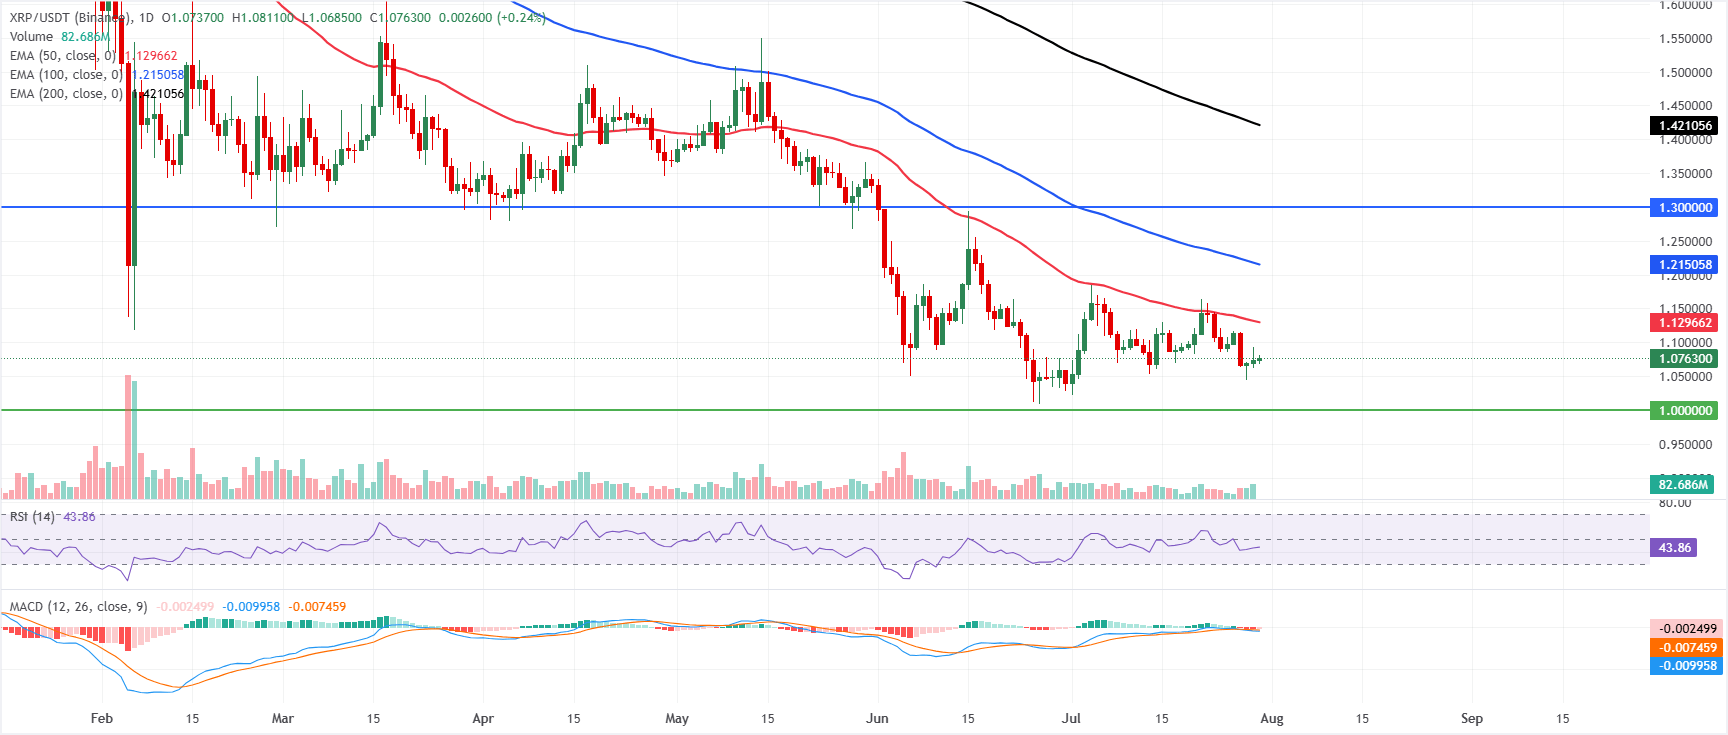
XRP price trades at $1.076 on Thursday, keeping a bearish near-term bias as price stays below the 50-day Exponential Moving Average (EMA) at $1.129, the 100-day EMA at $1.215, and the 200-day EMA at $1.421. The alignment of these EMAs above spot suggests a capped market, while the Relative Strength Index (RSI) near 43 hints at subdued but not oversold momentum. The Moving Average Convergence Divergence (MACD) has slipped marginally into negative territory, reinforcing the idea of fading upside pressure as rallies stall beneath clustered EMA resistance.
On the topside, initial resistance is seen at the 50-day EMA at $1.129, ahead of the 100-day EMA at $1.215 and the horizontal barrier at $1.300. Higher up, the 200-day EMA at $1.421 and the distant horizontal line at $1.900 mark broader recovery levels that would need to be reclaimed to neutralize the current bearish structure.
On the downside, immediate support sits at the psychological $1.000 handle, where a firm break would expose deeper losses. At the same time, a sustained defense of this floor could underpin a corrective bounce toward the mentioned EMA caps.
XLM technical outlook: Weakening momentum indicators
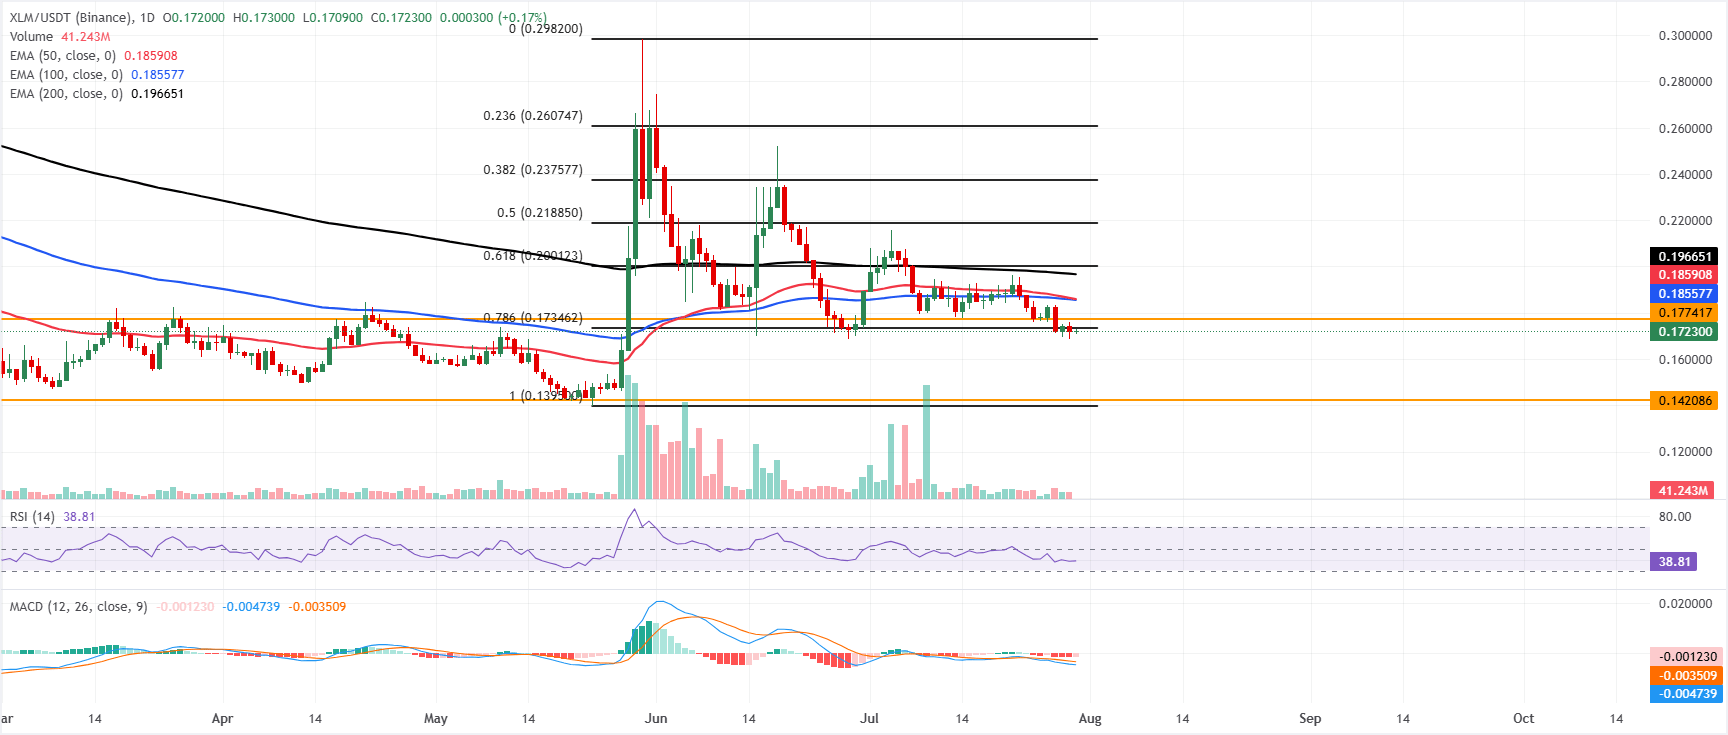
XLM price trades at $0.172 on Thursday, holding a bearish near-term bias as price remains below the 50-day, 100-day and 200-day EMAs clustered between roughly $0.185 and $0.196. The pair is hovering just under the 78.6% Fibonacci retracement at $0.173, suggesting topside attempts are being rejected near this pivot area, while the RSI around 38 and the MACD in negative territory both hint at weak recovery momentum and lingering downside risk.
On the topside, immediate resistance is located at the 78.6% Fibonacci retracement at $0.173, followed by the horizontal barrier at $0.177, with the EMA cluster at $0.185 and then the 200-day EMA at $0.196 reinforcing a broader supply zone ahead of the 61.8% Fibonacci retracement level at $0.200.
On the downside, key support is seen at the horizontal floor near $0.142, just above the cycle anchor at $0.139, where buyers would be expected to defend the broader uptrend.
(The technical analysis of this story was written with the help of an AI tool. Know more.)
Recommended Articles


