




Ripple and Stellar outlook: Extend downside as weakening technicals, US‑Iran tensions pressure prices
- XRP falls below $1.090, extending correction over 6% so far this week.
- XLM posts a fifth consecutive daily loss on Thursday, closing below a key EMA support level.
- Renewed US-Iran tensions and weakening technical indicators increase the risk of further downside for both XRP and XLM.
Ripple (XRP) and Stellar (XLM) extend losses on Thursday, correcting over 6% and 10%, respectively, so far this week. XRP falls below $1.090, while XLM posts a fifth consecutive day of correction and closes below key support levels. The bearish sentiment is further strengthened by renewed tensions between the US and Iran, dampening risk appetite and heightening the risk of deeper corrections for these altcoins.
Renewed US-Iran tensions cap risk sentiment
The fragile US-Iran relationship took a new development this week, with the US military unleashing a new wave of strikes against Iran in retaliation for Tehran’s attacks on commercial ships in the Strait of Hormuz.
Iran retaliated by continuously targeting US military installations and assets across Bahrain and Kuwait. Adding to this, US President Donald Trump said on Wednesday that the ceasefire with Iran was now over.
In addition to the growing tensions, the Minutes from the June 16–17 FOMC meeting were released on Wednesday and revealed that policymakers were divided over the direction of interest rates. The minutes reflected growing concern among Fed officials over inflation just as worries about the labor market slightly receded. Following the release, swap traders are now pricing the likelihood of a rate hike at the next Fed meeting at more than 30%, up from less than 20% last Thursday, according to the CME FedWatch tool.
The renewed geopolitical uncertainty and hawkish shift in rate expectations have dampened risk appetite, weighing on cryptocurrencies with Bitcoin (BTC) slipping below $62,000. At the same time, XRP and XLM continue their correction on Thursday.
Weakening institutional demand
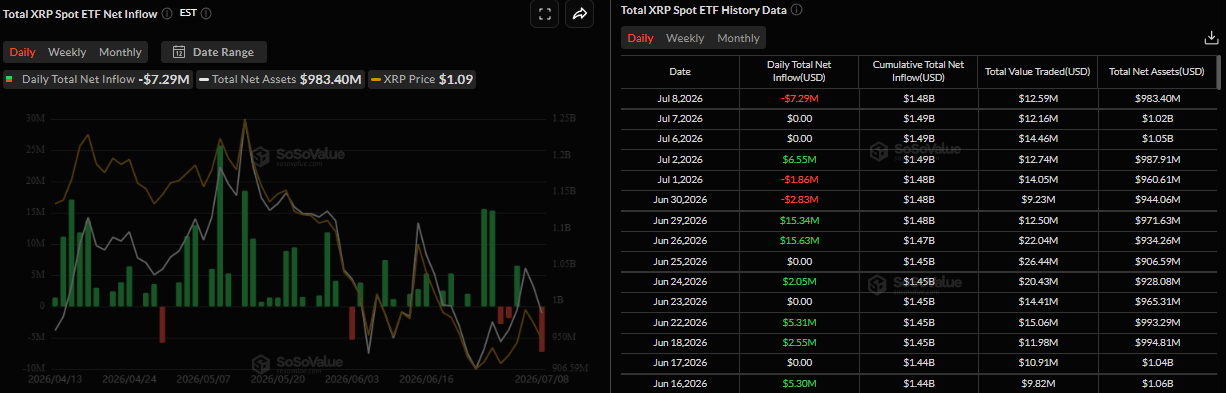
SoSoValue data shows institutional demand is cautious. Spot Exchange-Traded Funds (ETFs) recorded an outflow of $7.29 million on Wednesday after being muted in the previous two days. If this outflow trend continues and intensifies this week, XRP could see further correction.
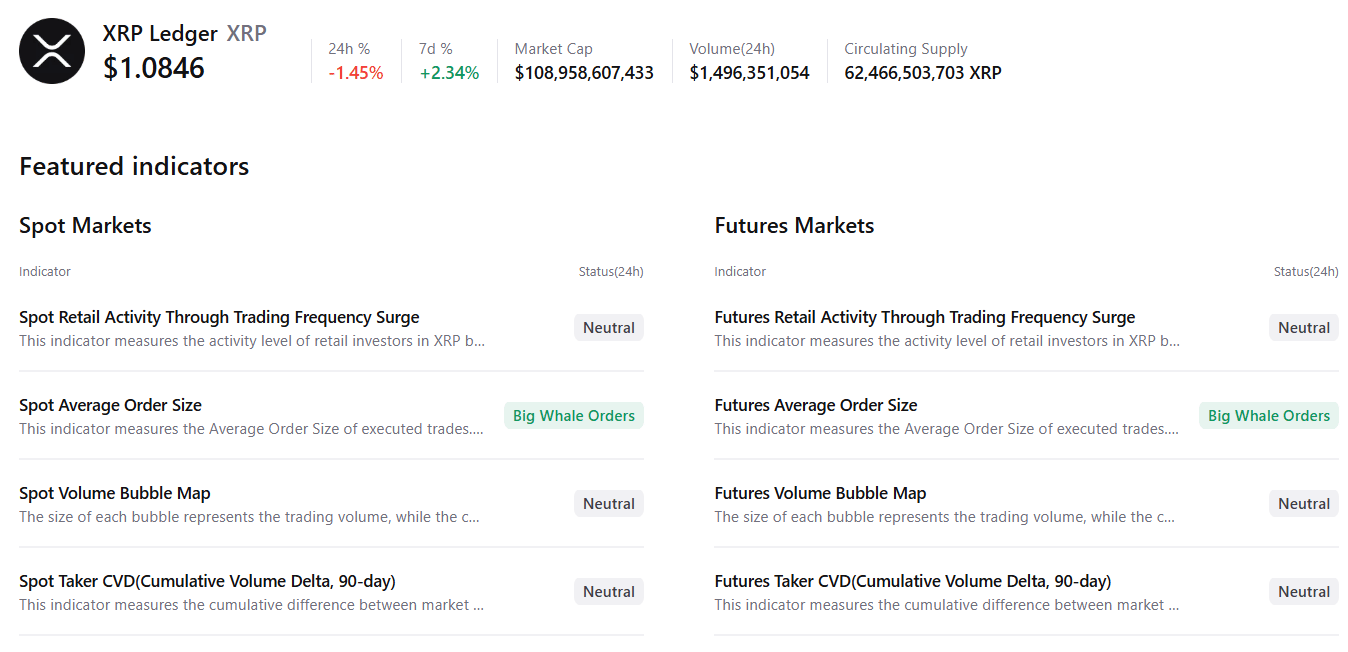
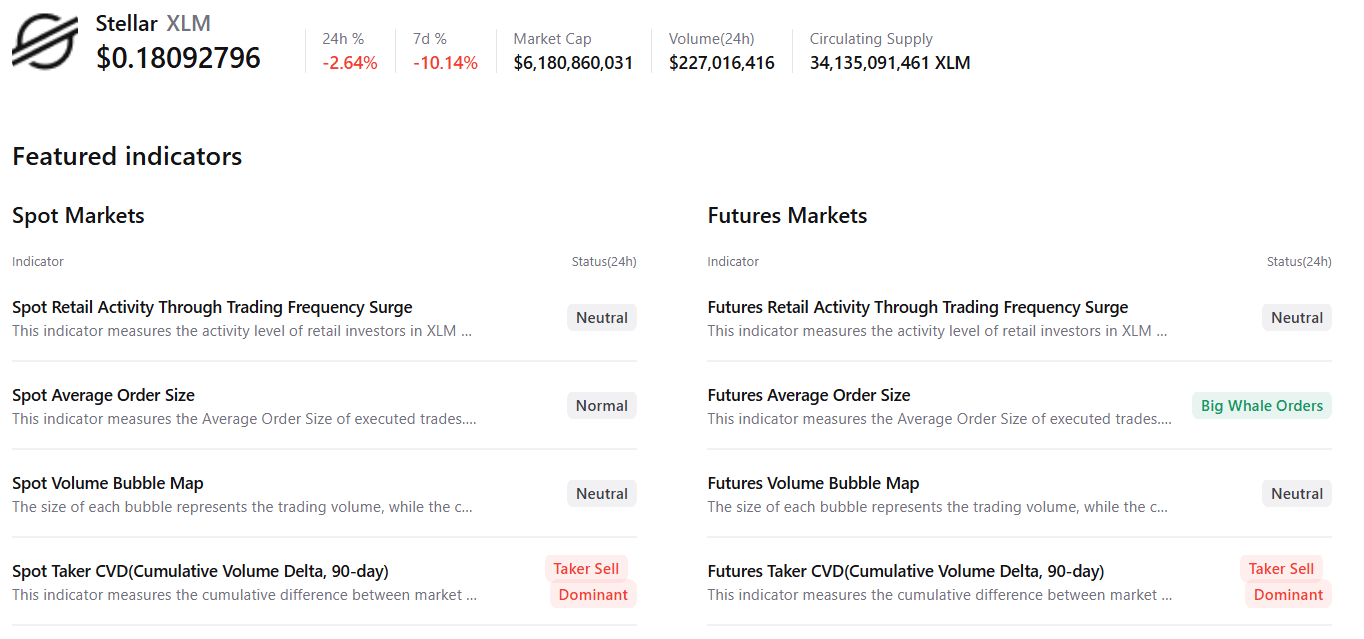
CryptoQuant’s summary data shows cautious optimism. XRP’s spot and futures markets show large-whale orders, while other metrics remain neutral, supporting a potential recovery. However, XLM shows selling-side dominance in both markets, with mixed retail activity and large-whale orders in the futures market, hinting at cautious sentiment among traders.
XRP technical outlook: Slips below key support
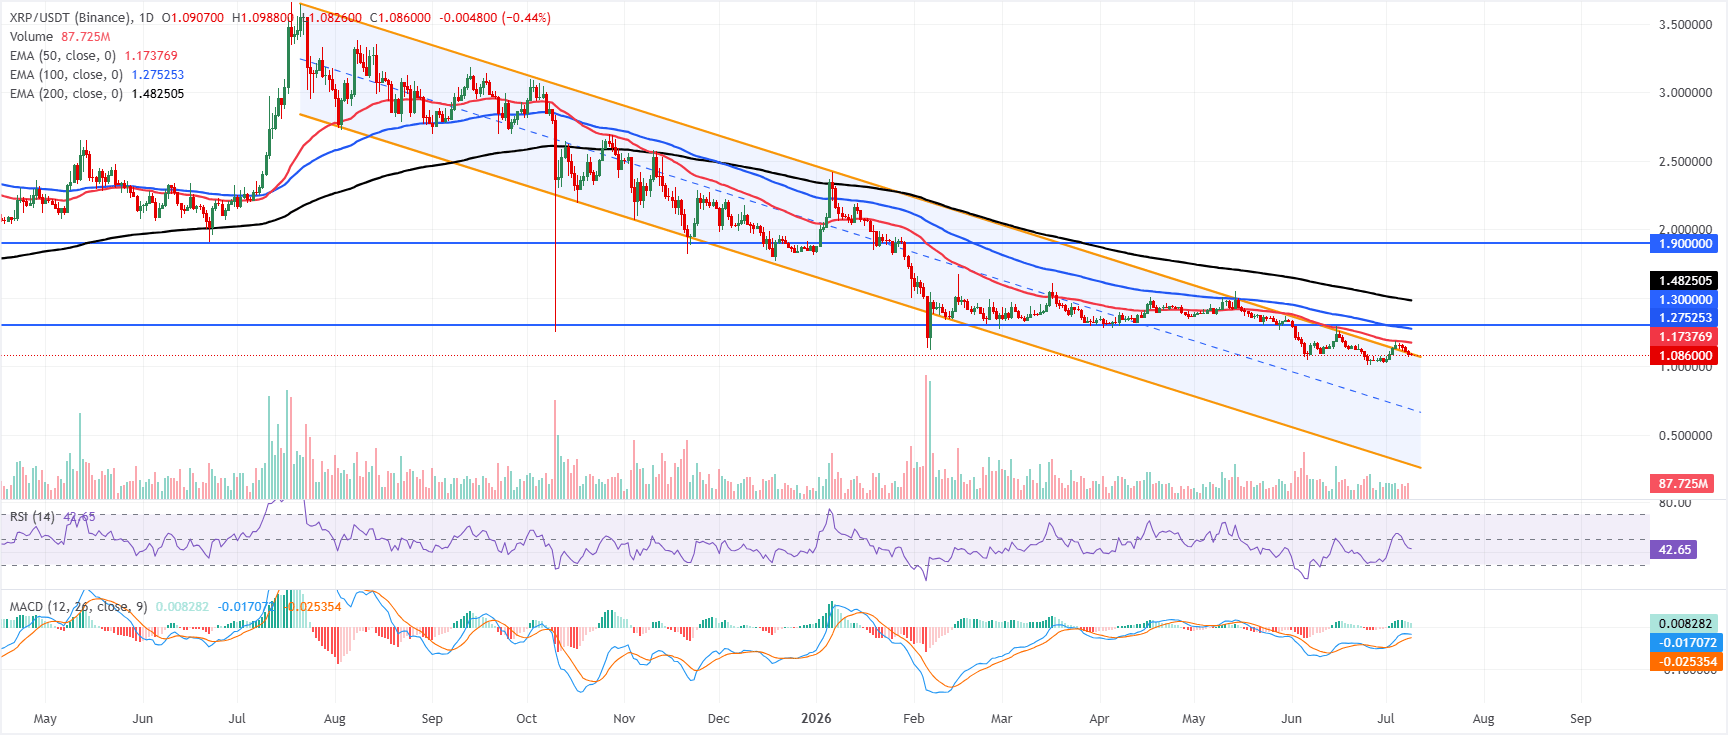
XRP price trades at $1.086 on Thursday, extending a bearish near-term bias as price holds well beneath the 50-day, 100-day and 200-day Exponential Moving Averages (EMAs) at $1.173, $1.275 and $1.482.
XRP also sits inside a downward-sloping parallel channel, with the upper boundary near $1.090 acting as immediate overhead supply, while the Relative Strength Index (RSI) around 42 points to subdued momentum and the Moving Average Convergence Divergence (MACD) indicator, still slightly positive but easing, hints at waning bullish attempts within a broader capped structure.
On the topside, initial resistance is aligned at the upper channel boundary around $1.090, followed by the 50-day EMA near $1.173. Above that, the 100-day EMA at $1.275 converges with horizontal resistance at $1.300, forming a thicker barrier ahead of the 200-day EMA near $1.482 and a higher structural cap at $1.900.
With no meaningful nearby support levels in the current dataset, any break above the $1.090 zone would be needed to ease immediate pressure. At the same time, a failure to reclaim the short-term averages would keep the daily bias tilted to the downside.
XLM technical outlook: Extends losses
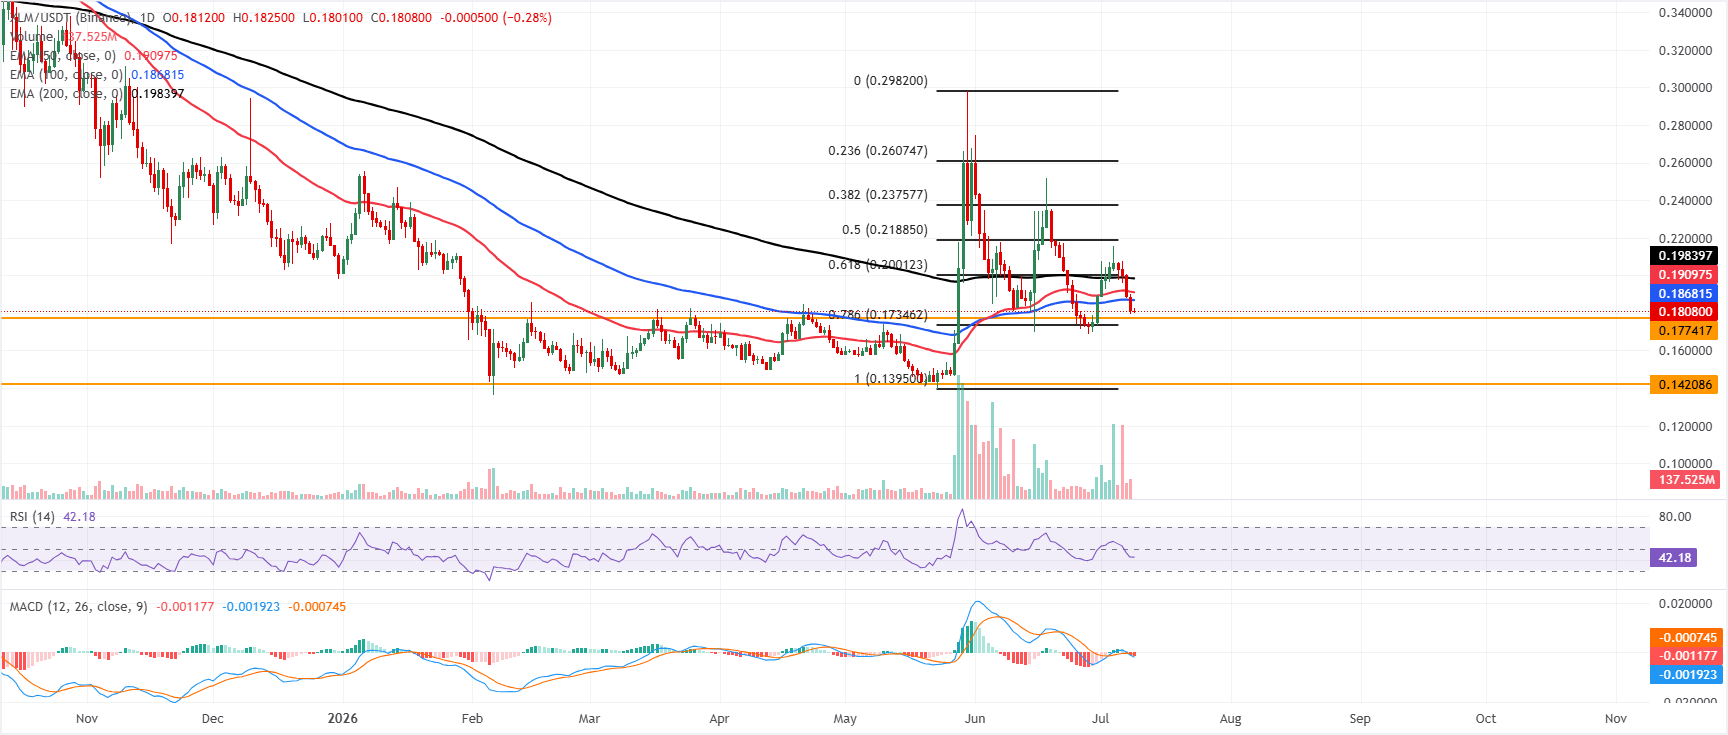
XLM price trades at $0.180 on Thursday, keeping a bearish near-term bias as price holds below the key EMAs. The 100-day EMA at $0.186, the 50-day EMA at $0.191 and the 200-day EMA at $0.198 all sit overhead, suggesting rallies are likely to be capped while the pair trades under this cluster of dynamic resistance.
Momentum indicators reinforce the soft tone, with the RSI hovering near 42 and the MACD back in negative territory, hinting that upside attempts could fade into supply.
On the downside, immediate support is located around the recent pivot zone near $0.180, ahead of a horizontal floor at $0.177. A deeper slide would expose the 78.6% Fibonacci retracement at $0.173, while a break beneath that level could open the way toward the next structural support around $0.142.
On the topside, initial resistance is seen at the 100-day EMA at $0.186, followed by the 50-day EMA at $0.191 and the 200-day EMA at $0.198. Above there, the 61.8% Fibonacci retracement at $0.200 and the 50% retracement near $0.218 are subsequent barriers, with higher Fibonacci levels at $0.237 and $0.260 likely to cap any extended recovery, while the broader structure remains bearish.
(The technical analysis of this story was written with the help of an AI tool. Know more.)
Recommended Articles


