




Bitcoin Weekly Forecast: Recovery hopes fade after the Fed spoils the party
- Bitcoin looks set to end the week in the red, gravitating toward the key 200-week SMA around $62,300.
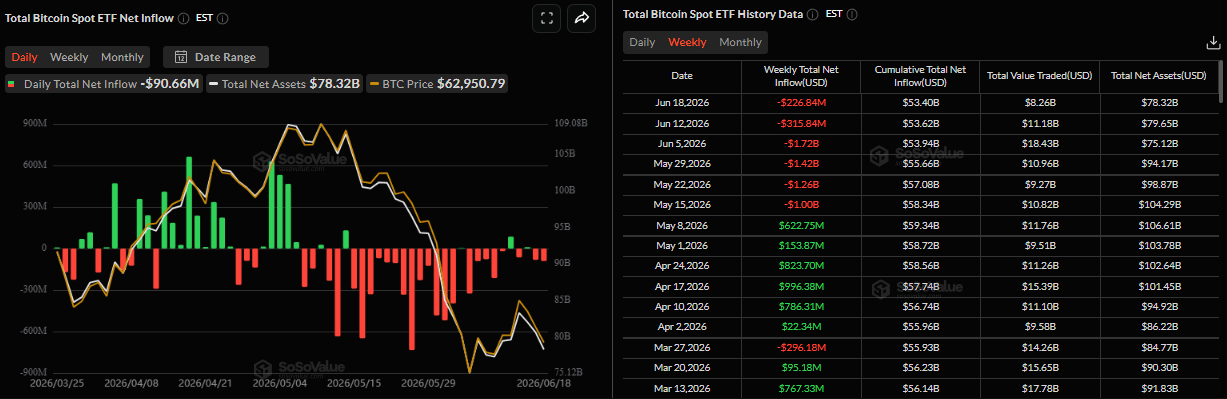
- Institutional selling persists, with spot Bitcoin ETFs pointing to a sixth consecutive week of withdrawals.
- A hawkish Fed stance, alongside fading optimism over the US-Iran peace deal, weighs on BTC.
Bitcoin (BTC) is set to end the week in the red, trading near the 200-Week Simple Moving Average (SMA) at around $62,300 on Friday. Institutional selling persists, capping BTC’s recovery as spot Exchange Traded Funds (ETFs) point to a sixth consecutive week of outflows. Meanwhile, risk sentiment remains dampened this week as hawkish Federal Reserve (Fed) forward guidance and fading optimism over the US-Iran peace deal weigh on Crypto King’s recovery.
US-Iran deal uncertainty dampens risk appetite
The optimism led by an interim US-Iran peace deal fades as key issues between the two countries remain unresolved. Moreover, US Vice President J.D. Vance canceled his planned trip to Switzerland to meet with Iran this Friday, saying the meeting wasn’t finalized yet and citing logistical reasons. Adding to this, Israeli air strikes in Lebanon threaten to unravel the US-Iran agreement.
These developments have kept uncertainty high, boosting the safe-haven US Dollar (USD) and weighing on risk-sensitive assets such as Bitcoin, which has remained under pressure, trading below $63,000 on Friday.
Traders should be cautious, as any renewed escalation of tensions in the Middle East, along with a lack of progress in US-Iran negotiations or negative comments over the weekend, could further push BTC lower.
Macroeconomic outlook: Fed hawkish forward projection weighs on BTC
The US Fed announced the interest rate decision late Wednesday. The US central bank, as widely expected, kept its benchmark interest rate unchanged at a target range of 3.50% to 3.75% in what was Kevin Warsh’s first meeting as Fed Chair.
Traders were especially focused this time on the central bank’s forward guidance and on Kevin Warsh’s words. The Fed eliminated the language indicating a bias toward further easing, with the rate-setting committee sending a clear message that it supported higher rates. In fact, policymakers estimated the Fed funds rate at 3.8% by the end of this year, up from 3.4% projected in March.
Traders were quick to react to the bank’s hawkish guidance and are now pricing in nearly an 85% chance of a rate hike in December. The shift in expectations pushed US Treasury yields and the USD higher, reducing the appetite for risk assets. As a result, Bitcoin came under renewed selling pressure, as investors trimmed exposure to risk-sensitive assets.
Institutional selling continues
Institutional demand continued to weaken so far this week. SoSoValue data shows that spot BTC ETFs recorded an outflow of $226.84 million up to Thursday so far this week. Unless Friday’s inflows are very significant, BTC is about to mark the sixth week of steady withdrawals. This signals that institutional demand continues to weaken and fails to provide a cushion against falling BTC prices.
Meanwhile, on-chain data shows that a wallet address linked to the Royal Government of Bhutan transferred 533.2 BTC, worth $34.52 million, to Binance on Wednesday. Generally, BTC transfers to exchanges indicate a potential selling signal, adding to bearish sentiment. The country still holds about 1750 BTC, valued at roughly $113 million.
However, on the corporate front, Michael Saylor announced on Monday that his firm Strategy has acquired 1,587 BTC, bringing the total holding to 846,842 BTC. In addition, the firm also increased its USD Reserve by $100 million to $1.1 billion. This highlights the company’s continued conviction in Bitcoin and aggressive accumulation despite the recent BTC price correction.
Other signs of concern
As explained in the previous report, BTC staged a tentative relief bounce last week from deeply oversold levels, and current market conditions suggest stabilization rather than a trend reversal.
In addition, the rebound appears to have been driven largely by seller exhaustion rather than a meaningful recovery in investor demand, suggesting the rally may lack a solid foundation.
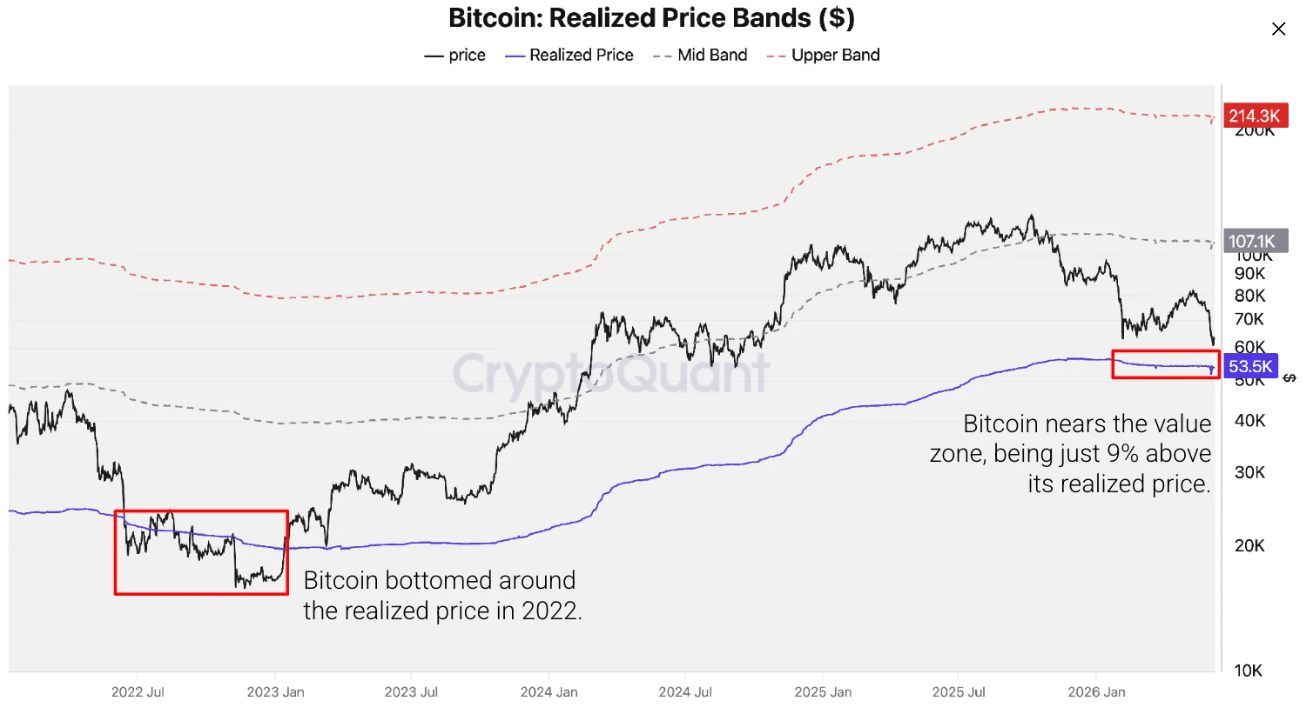
Unless fresh buying interest emerges, BTC could extend its ongoing correction toward $53,500, a level that has historically marked bear-market bottoms in previous cycles.
Technical outlook: Will the key level hold?
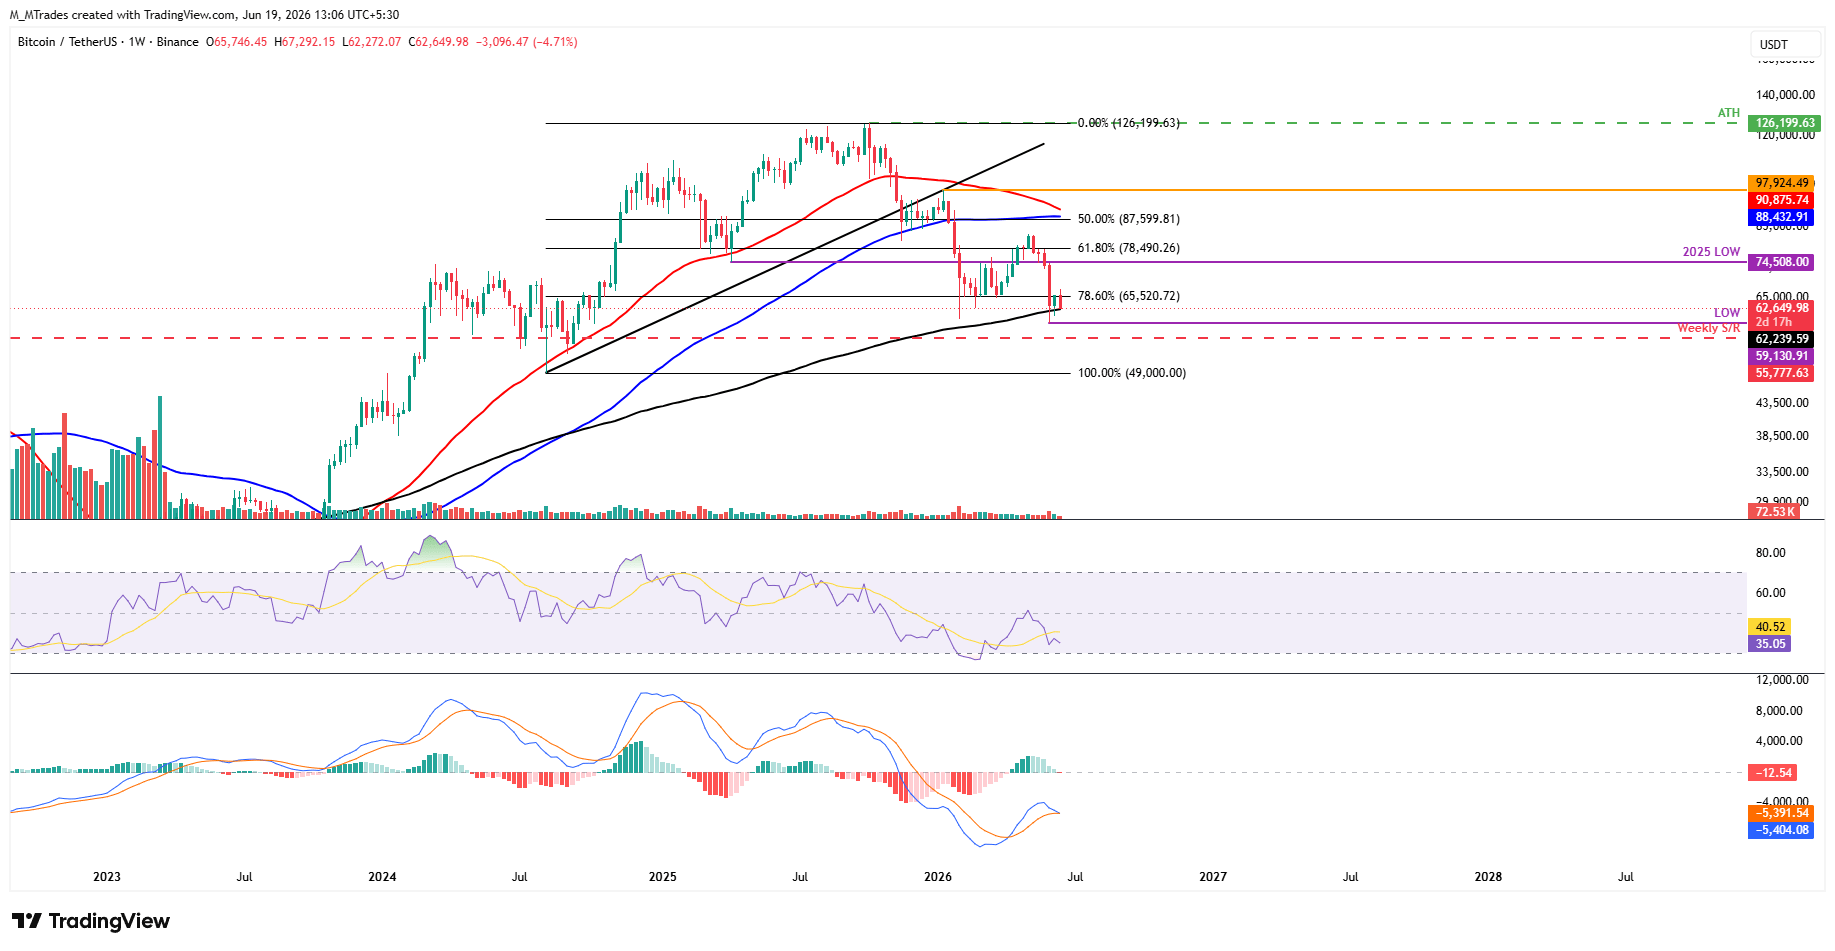
Bitcoin failed to clear the key 78.60% Fibonacci retracement level at $65,520 (drawn from the August 2024 low of $49,000 to the October 2026 record high of $126,199) earlier this week, declining over 4.71%. As of Friday, BTC is gravitating toward the key 200-week SMA at $62,239, which has acted as key support.
If BTC continues its correction and closes below the 200-week SMA at $62,239 on a weekly basis, it could extend the decline toward the next weekly support at $55,777.
Momentum indicators on the weekly chart show signs of concern: the Relative Strength Index (RSI) is trending lower and nearing oversold territory, with a reading of 35 on Friday. Meanwhile, the Moving Average Convergence Divergence (MACD) is about to flip to a bearish crossover, suggesting a negative outlook.
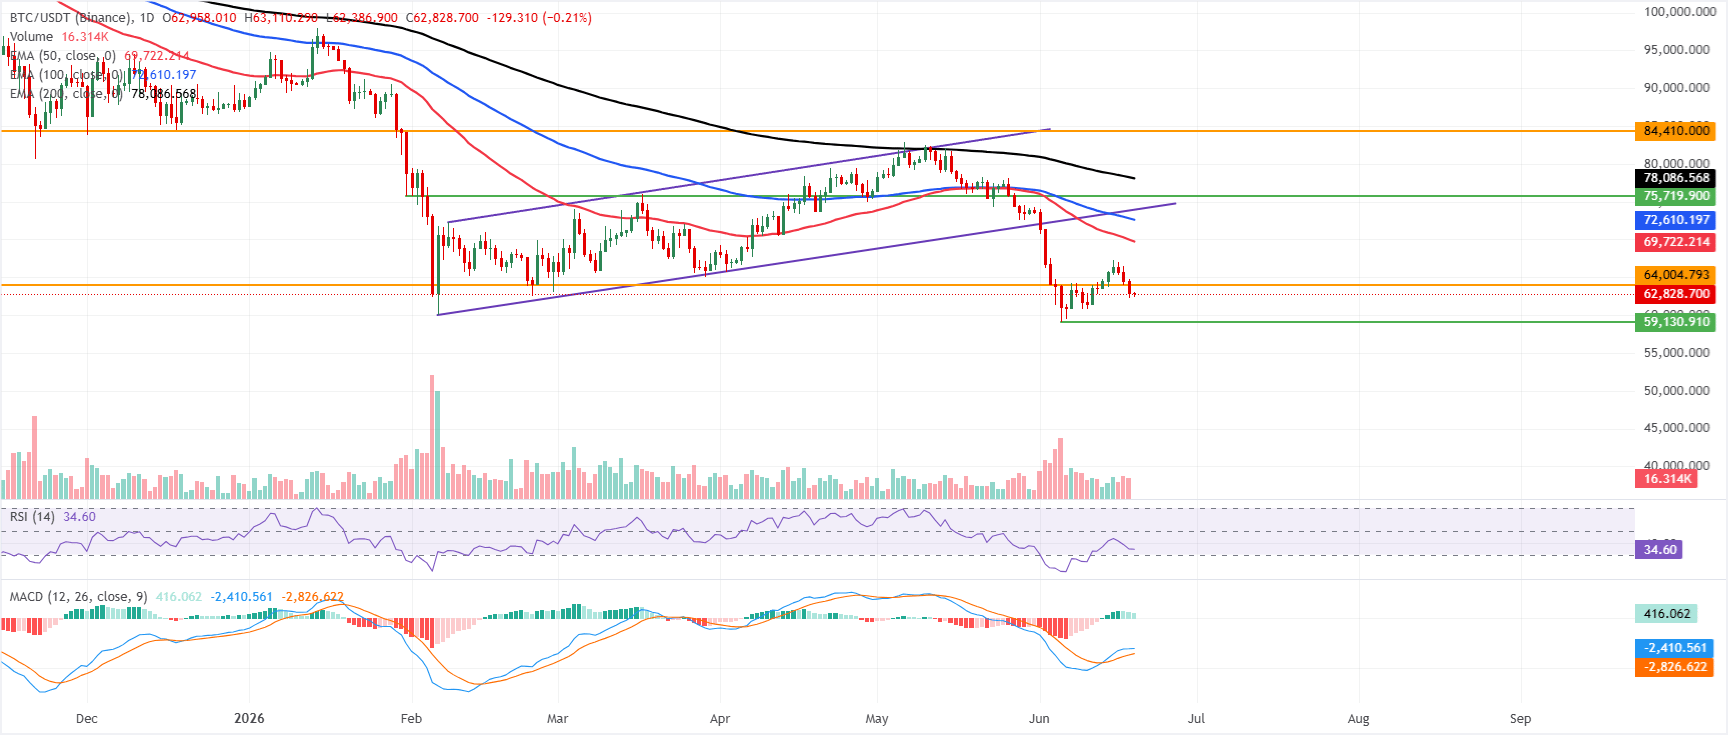
On the daily chart, BTC is extending a corrective phase below all key Exponential Moving Averages (EMAs), which cluster well above the current trading level, reinforcing a bearish near-term bias.
The loss of the former rising support line, now a broken trend floor-turned-resistance around $73,925, underscores a market that remains capped despite the recent rebound. The Relative Strength Index (RSI) on the daily chart is hovering in the mid-30s, hinting at persistent but not yet extreme downside pressure. Meanwhile, the Moving Average Convergence Divergence (MACD) histogram holds above the zero line with a positive reading, suggesting that bearish momentum is moderating rather than accelerating.
On the topside, initial resistance emerges near $64,005, where a horizontal barrier sits just above the current price and guards a stronger recovery toward the 50-day EMA around $69,722. Above that, the 100-day EMA at roughly $72,610 and the broken rising trend line near $73,925 form a dense mid-term cap, ahead of the 200-day EMA close to $78,086 and the major horizontal ceiling at $84,410, which together mark the upper boundary of the broader corrective range; with no nearby structural supports identified below spot in this dataset, any renewed selling would leave Bitcoin vulnerable to discovering fresh demand at lower levels.
(The technical analysis of this story was written with the help of an AI tool.)
Bitcoin, altcoins, stablecoins FAQs
Bitcoin is the largest cryptocurrency by market capitalization, a virtual currency designed to serve as money. This form of payment cannot be controlled by any one person, group, or entity, which eliminates the need for third-party participation during financial transactions.
Altcoins are any cryptocurrency apart from Bitcoin, but some also regard Ethereum as a non-altcoin because it is from these two cryptocurrencies that forking happens. If this is true, then Litecoin is the first altcoin, forked from the Bitcoin protocol and, therefore, an “improved” version of it.
Stablecoins are cryptocurrencies designed to have a stable price, with their value backed by a reserve of the asset it represents. To achieve this, the value of any one stablecoin is pegged to a commodity or financial instrument, such as the US Dollar (USD), with its supply regulated by an algorithm or demand. The main goal of stablecoins is to provide an on/off-ramp for investors willing to trade and invest in cryptocurrencies. Stablecoins also allow investors to store value since cryptocurrencies, in general, are subject to volatility.
Bitcoin dominance is the ratio of Bitcoin's market capitalization to the total market capitalization of all cryptocurrencies combined. It provides a clear picture of Bitcoin’s interest among investors. A high BTC dominance typically happens before and during a bull run, in which investors resort to investing in relatively stable and high market capitalization cryptocurrency like Bitcoin. A drop in BTC dominance usually means that investors are moving their capital and/or profits to altcoins in a quest for higher returns, which usually triggers an explosion of altcoin rallies.
Recommended Articles


