


Bitcoin Price Stalls at $76,000 as Wall Street Builds a Fund That Profits From It
Bitcoin price briefly tagged $76,100 on April 14 before pulling back on heavy selling pressure. The rejection came during the same day Goldman Sachs filed for a Bitcoin Premium Income ETF.
The new fund uses a covered call strategy that profits when BTC trades flat or rises only modestly. That makes the $76,000 resistance more than a technical wall. It is where Wall Street’s newest product is designed to thrive.
Short Liquidations Drive Rally but Open Interest Collapses
Bitcoin price rose roughly 4.4% over the past seven days. However, the majority of the move came in the last few sessions. Derivatives, not spot demand, fueled the push.
On April 14, open interest peaked at $28.55 billion with the BTC funding rate at negative 0.013%. That negative reading meant short sellers were paying to hold positions. As BTC pushed higher, those shorts possibly got liquidated, adding fuel to the bounce.
Yet the aftermath tells a different story. Open interest has since collapsed to $8.42 billion, a near 70% drop. Funding has dropped further to negative 0.048%. Meanwhile, new short positions are being built even as the price holds near its local highs.
Want more token insights like this? Sign up for Editor Harsh Notariya’s Daily Crypto Newsletter here.
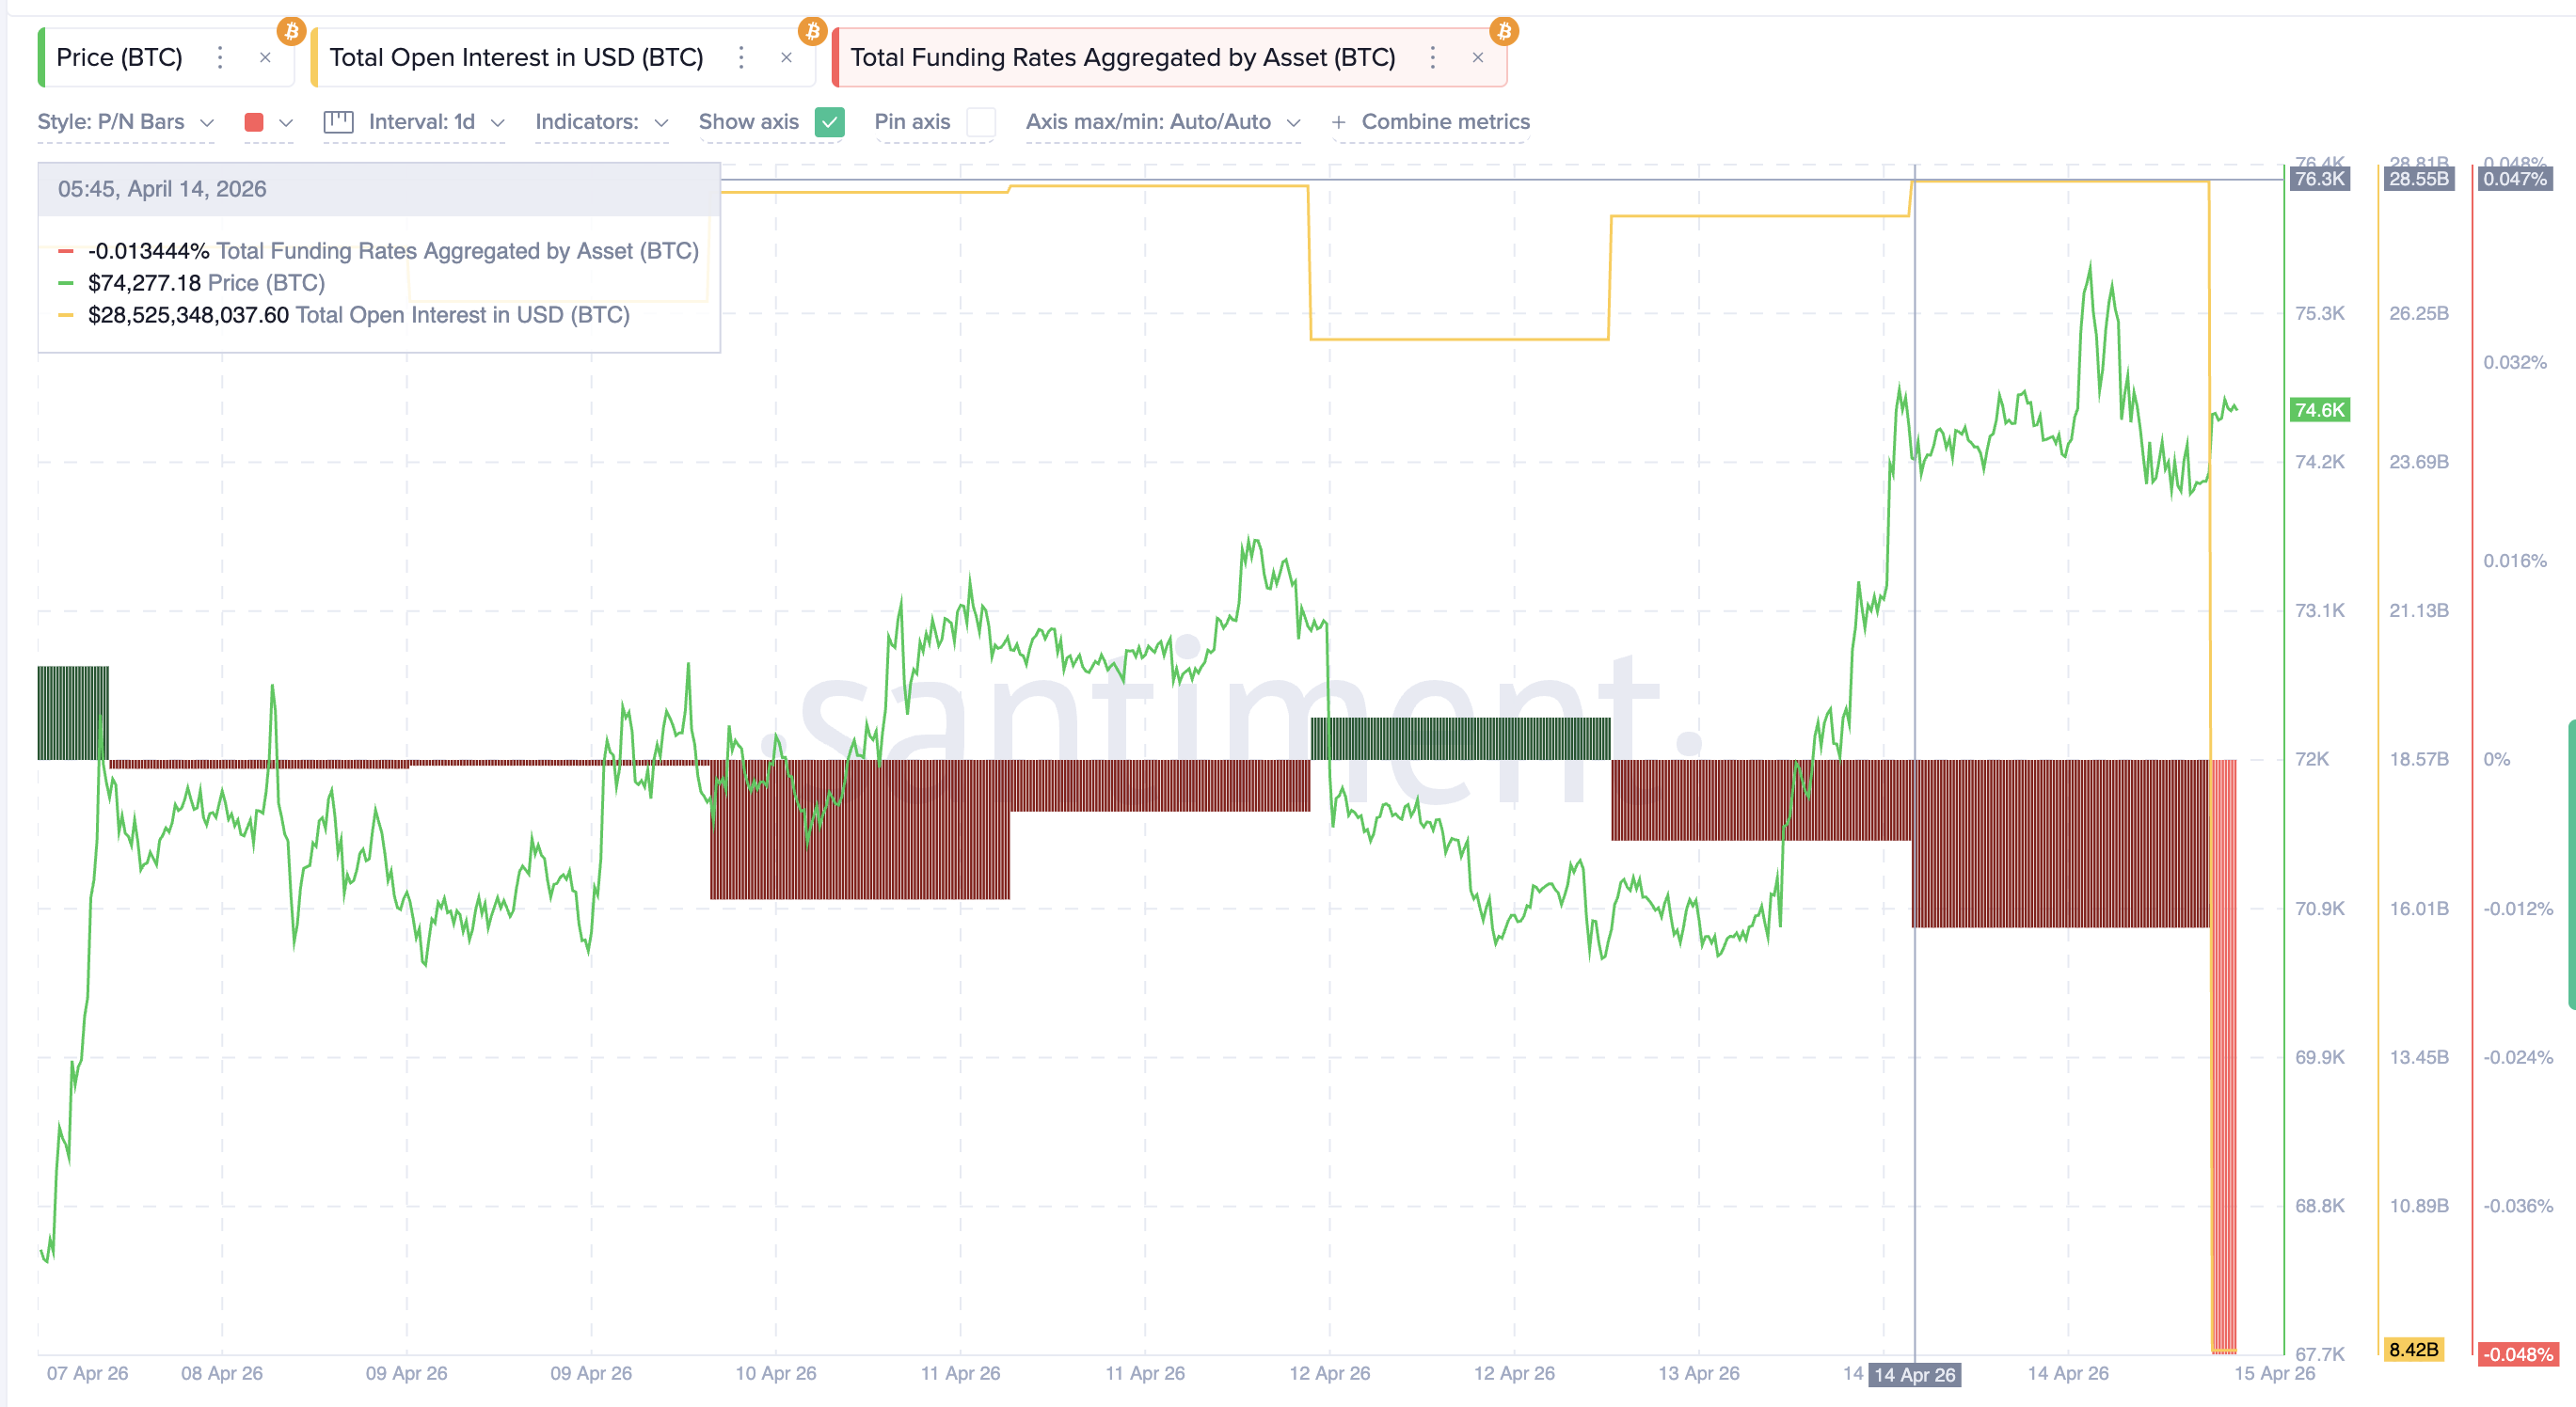 Derivatives Open Interest: Santiment
The upper wick on the April 14 daily candle confirms that sellers stepped in aggressively near $76,100. The rally was derivative-driven, and the fuel behind it has already evaporated. Whether the next push comes from fresh longs or another short squeeze depends on the resistance level above. In addition to that, the recent squeezed push anf the subsequent seller-driven pullback seems to have helped Bitcoin complete a Cup-and-Handle pattern on the daily chart.
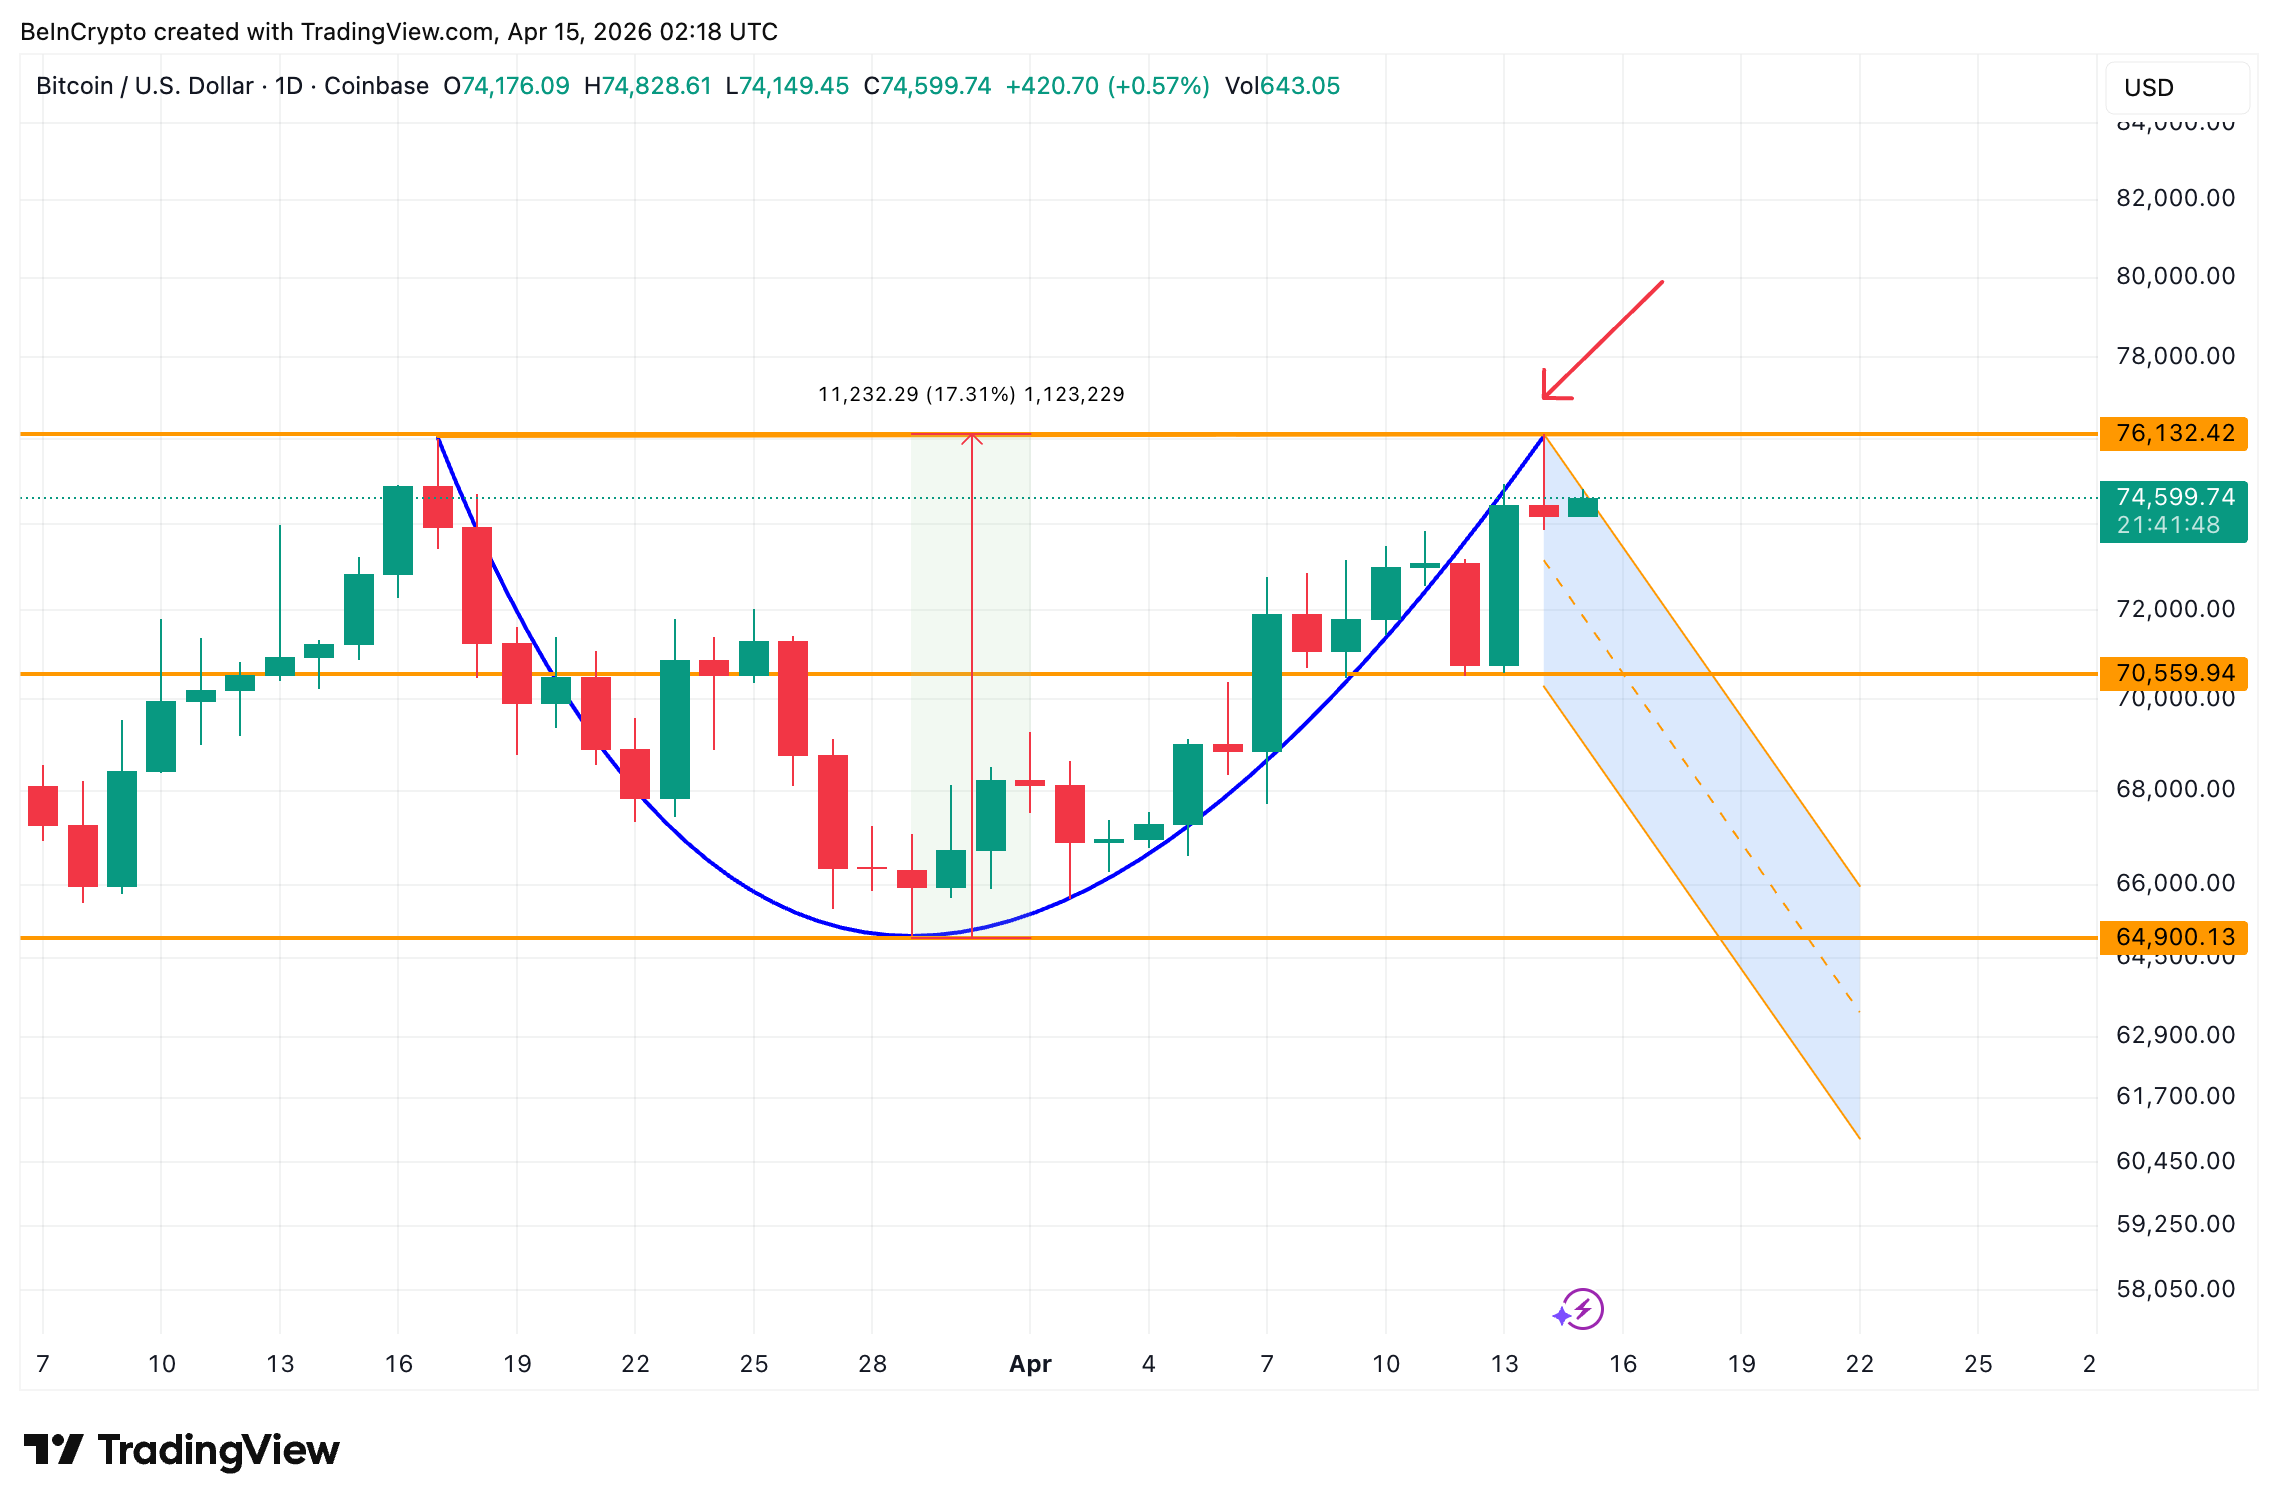 Bullish BTC Pattern: TradingView
The neckline seems to be a horizontal one, near the $76,132 mark whereas the pattern invalidation level now sits at $64,900. The current pullback could be forming the handle of the pattern. However, one critical on-chain zone now flashes.
One On-Chain Wall Meets Goldman’s New ETF
The rejection near $76,000 aligns with on-chain resistance. CryptoQuant data on realized price by UTXO age bands, a metric that tracks the average purchase price of Bitcoin grouped by how long each coin has been held, shows the 1-month to 3-month cohort sitting at $76,662.That cohort represents the most active recent buyers, and their cost basis is now the first ceiling BTC must clear.
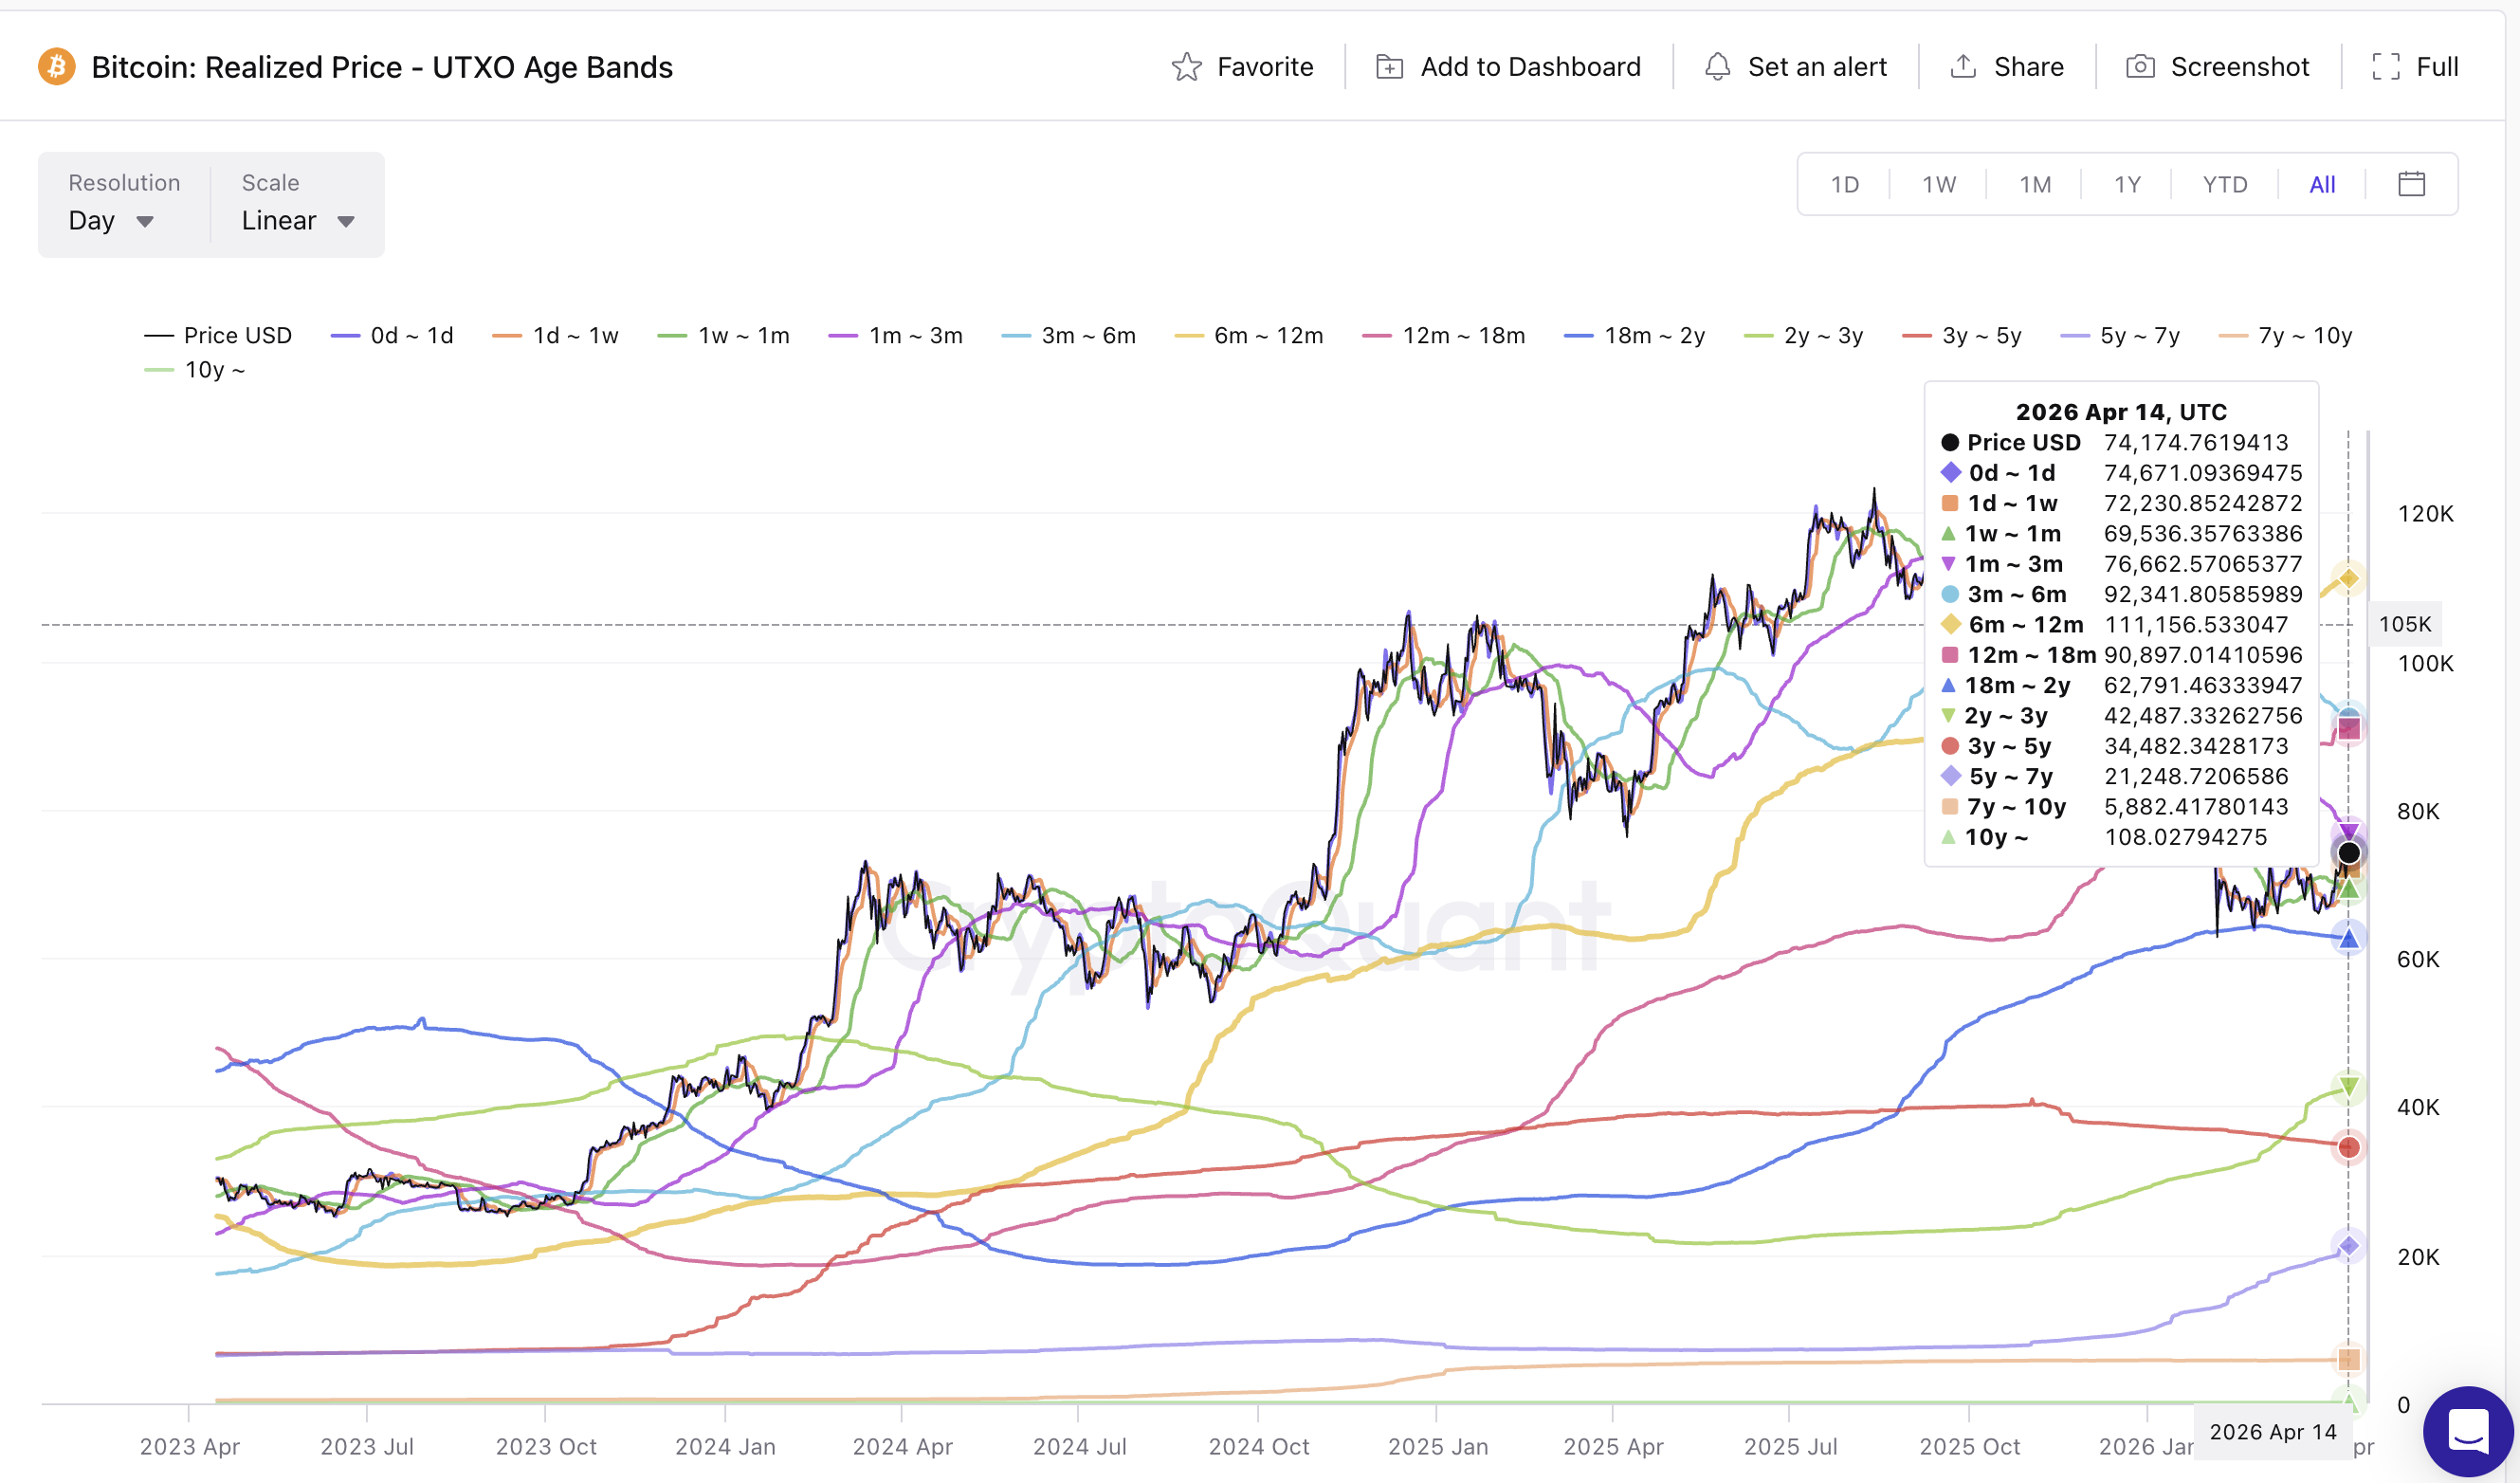 BTC UTXO Realized Price Age Bands: CryptoQuant
Meanwhile, Goldman Sachs filed with the SEC on April 14 for a Bitcoin Premium Income ETF. The fund sells call options against spot Bitcoin ETF holdings, collecting premiums in exchange for capping upside. Bloomberg analyst Eric Balchunas noted the filing uses a ’40 Act structure. A Cayman subsidiary handles commodity holding restrictions.
The product outperforms when BTC trades sideways or falls modestly.
The timing matters. If the $76,662 on-chain wall holds and BTC consolidates below it, products like Goldman’s ETF become immediately relevant. Despite the bullish pattern on the chart, they profit from exactly the kind of range-bound action BTC is showing. Bitcoin open interest needs to rebuild alongside fresh demand to break through.
Bitcoin Price Levels That Determine What Comes Next
As mentioned earlier, the neckline of the bullish continuation pattern sits nearly horizontal at $76,132. The consolidation that started on April 14 could develop into the handle. While BTC holds above $70,559, the pattern remains intact. The pattern carries a projected move of 17.31%.
However, the neckline alone is not sufficient. The UTXO wall at $76,662, the 0.618 Fibonacci at $76,039, and the rejection high at $76,132 all cluster together. A daily close above $76,665 would clear that entire zone. Targets then open at $77,530, $79,429, $84,914, and the projected move near $89,272.
Yet the derivatives picture complicates the outlook. Open interest must rise alongside price for a sustained breakout. Without that, the negative funding and growing short interest could trigger another squeeze, but any resulting rally risks being short-lived.
Bitcoin price support sits at $73,944, the 0.382 Fibonacci level. A loss of that exposes $70,554, which could weaken the pattern. However, only a close below $64,900 would fully invalidate the cup-and-handle pattern.
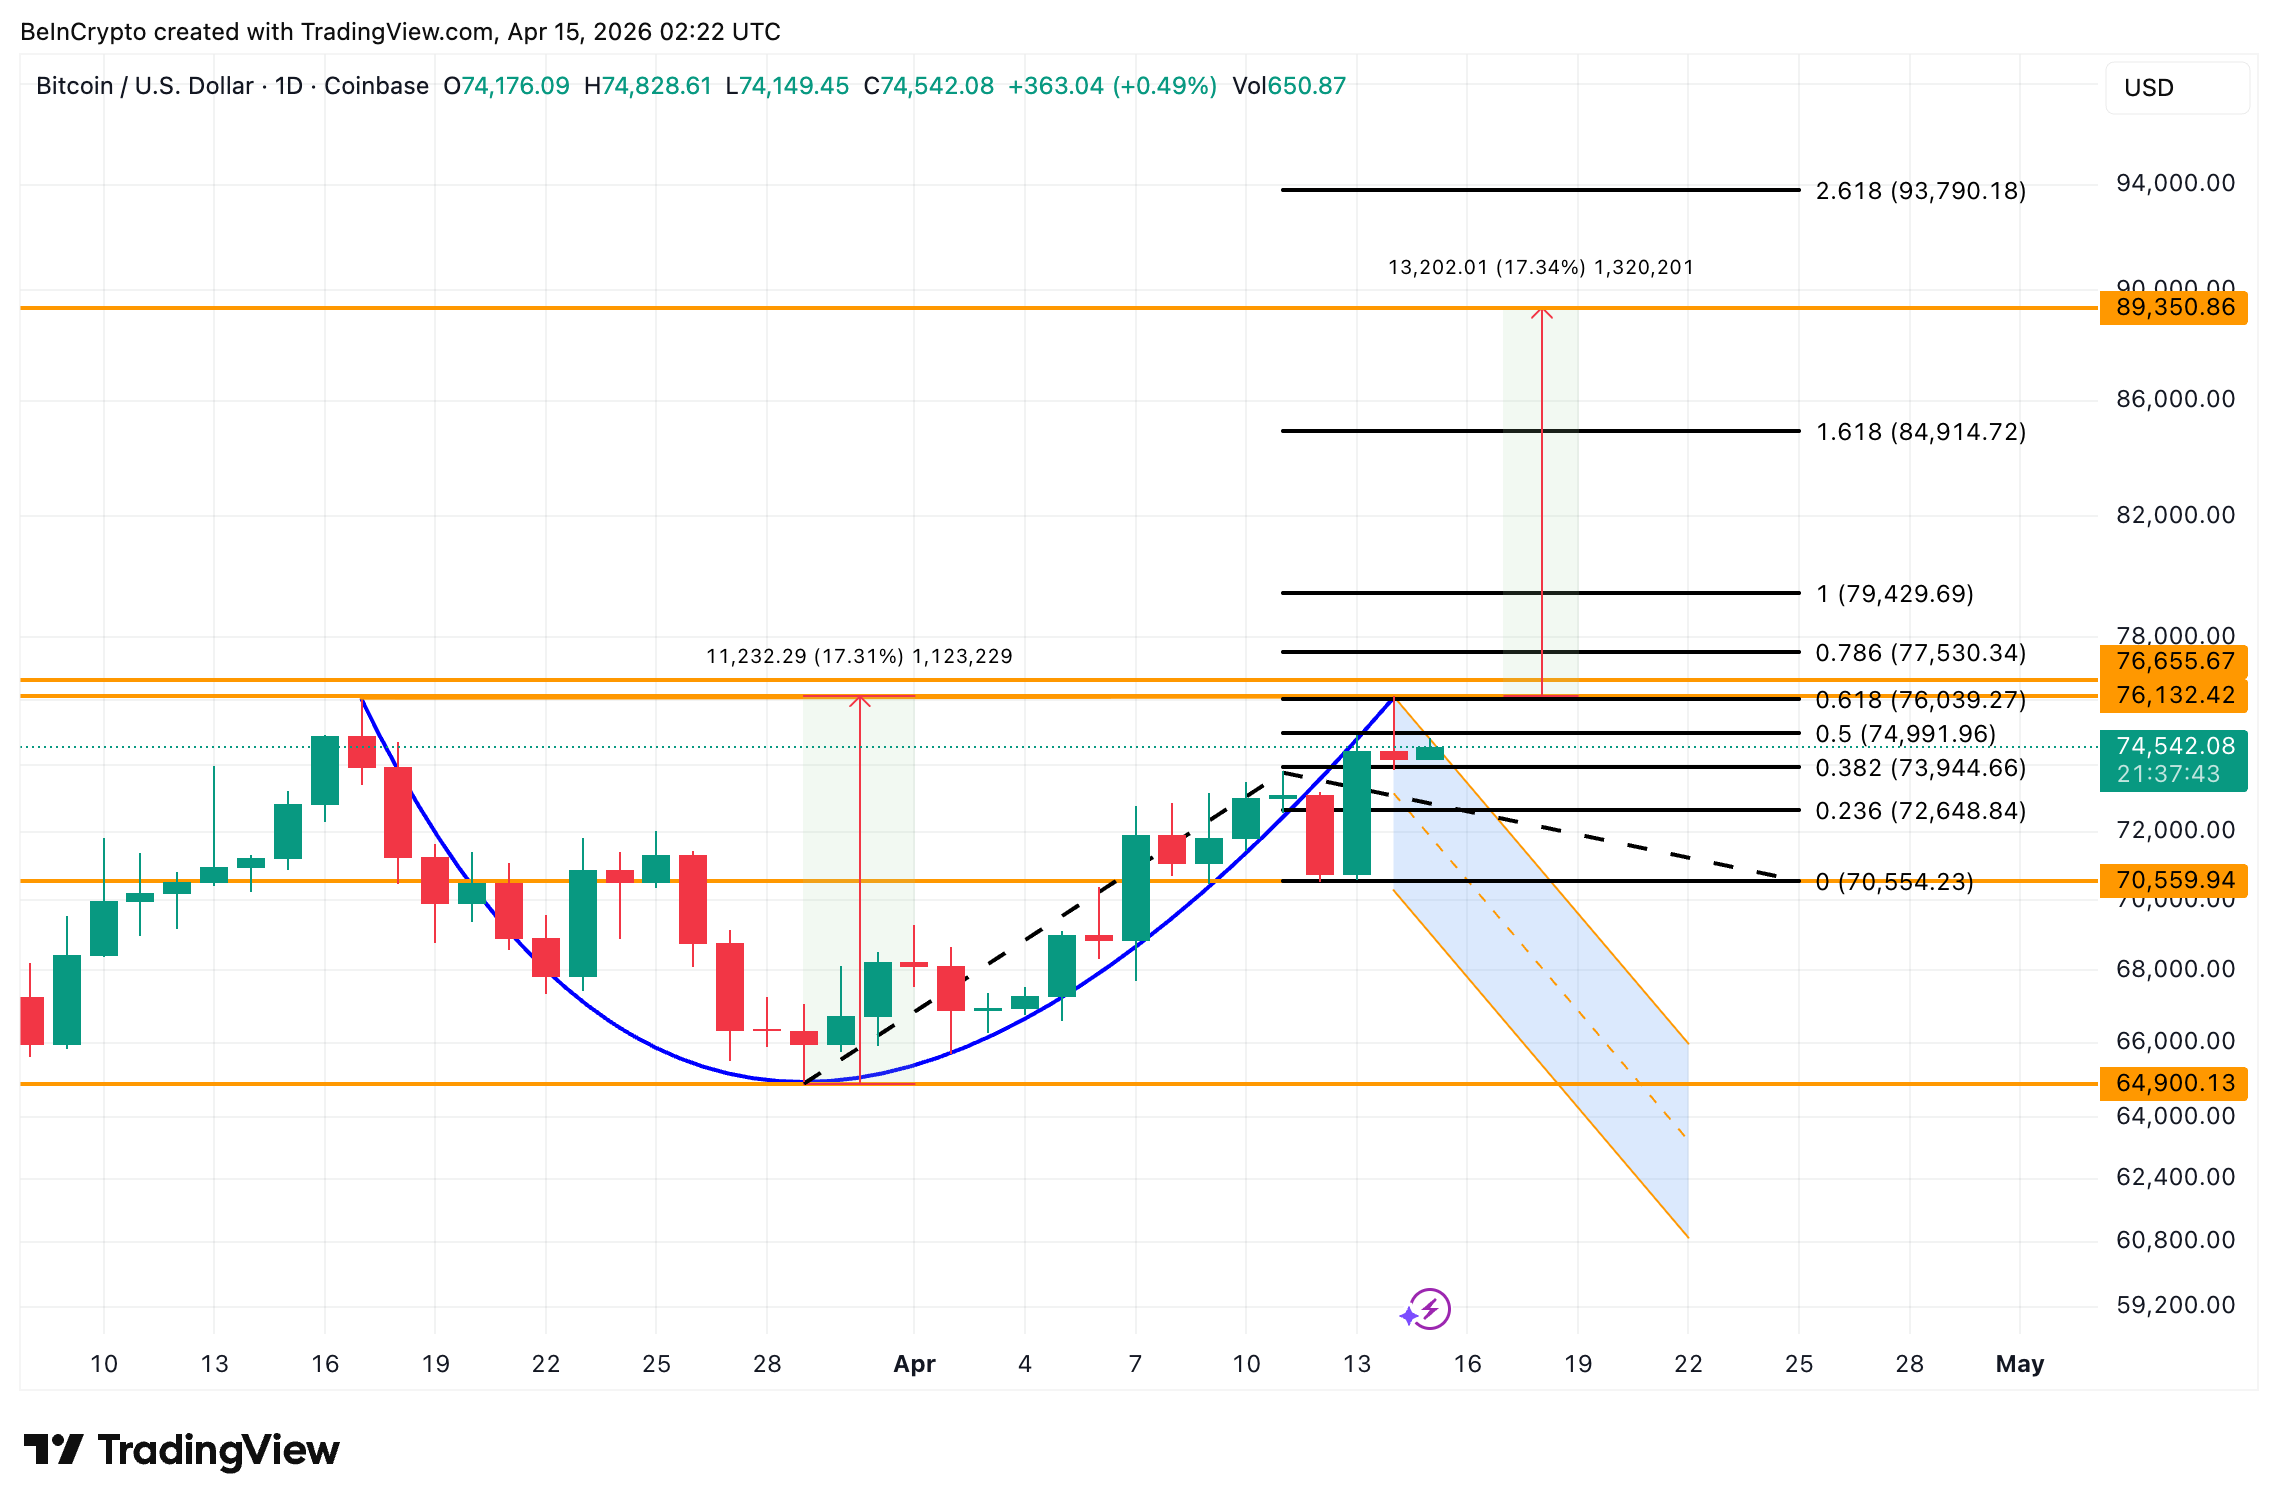 Bitcoin Price Analysis: TradingView
A daily close above $76,665 activates the $89,272 target. A close below $73,944 hands momentum back to the shorts. That is exactly what aligns with the logic of Goldman’s new ETF.
Recommended Articles


