


Gold Price Takes a Petrodollar Hit, but the $5,000 Setup Survives


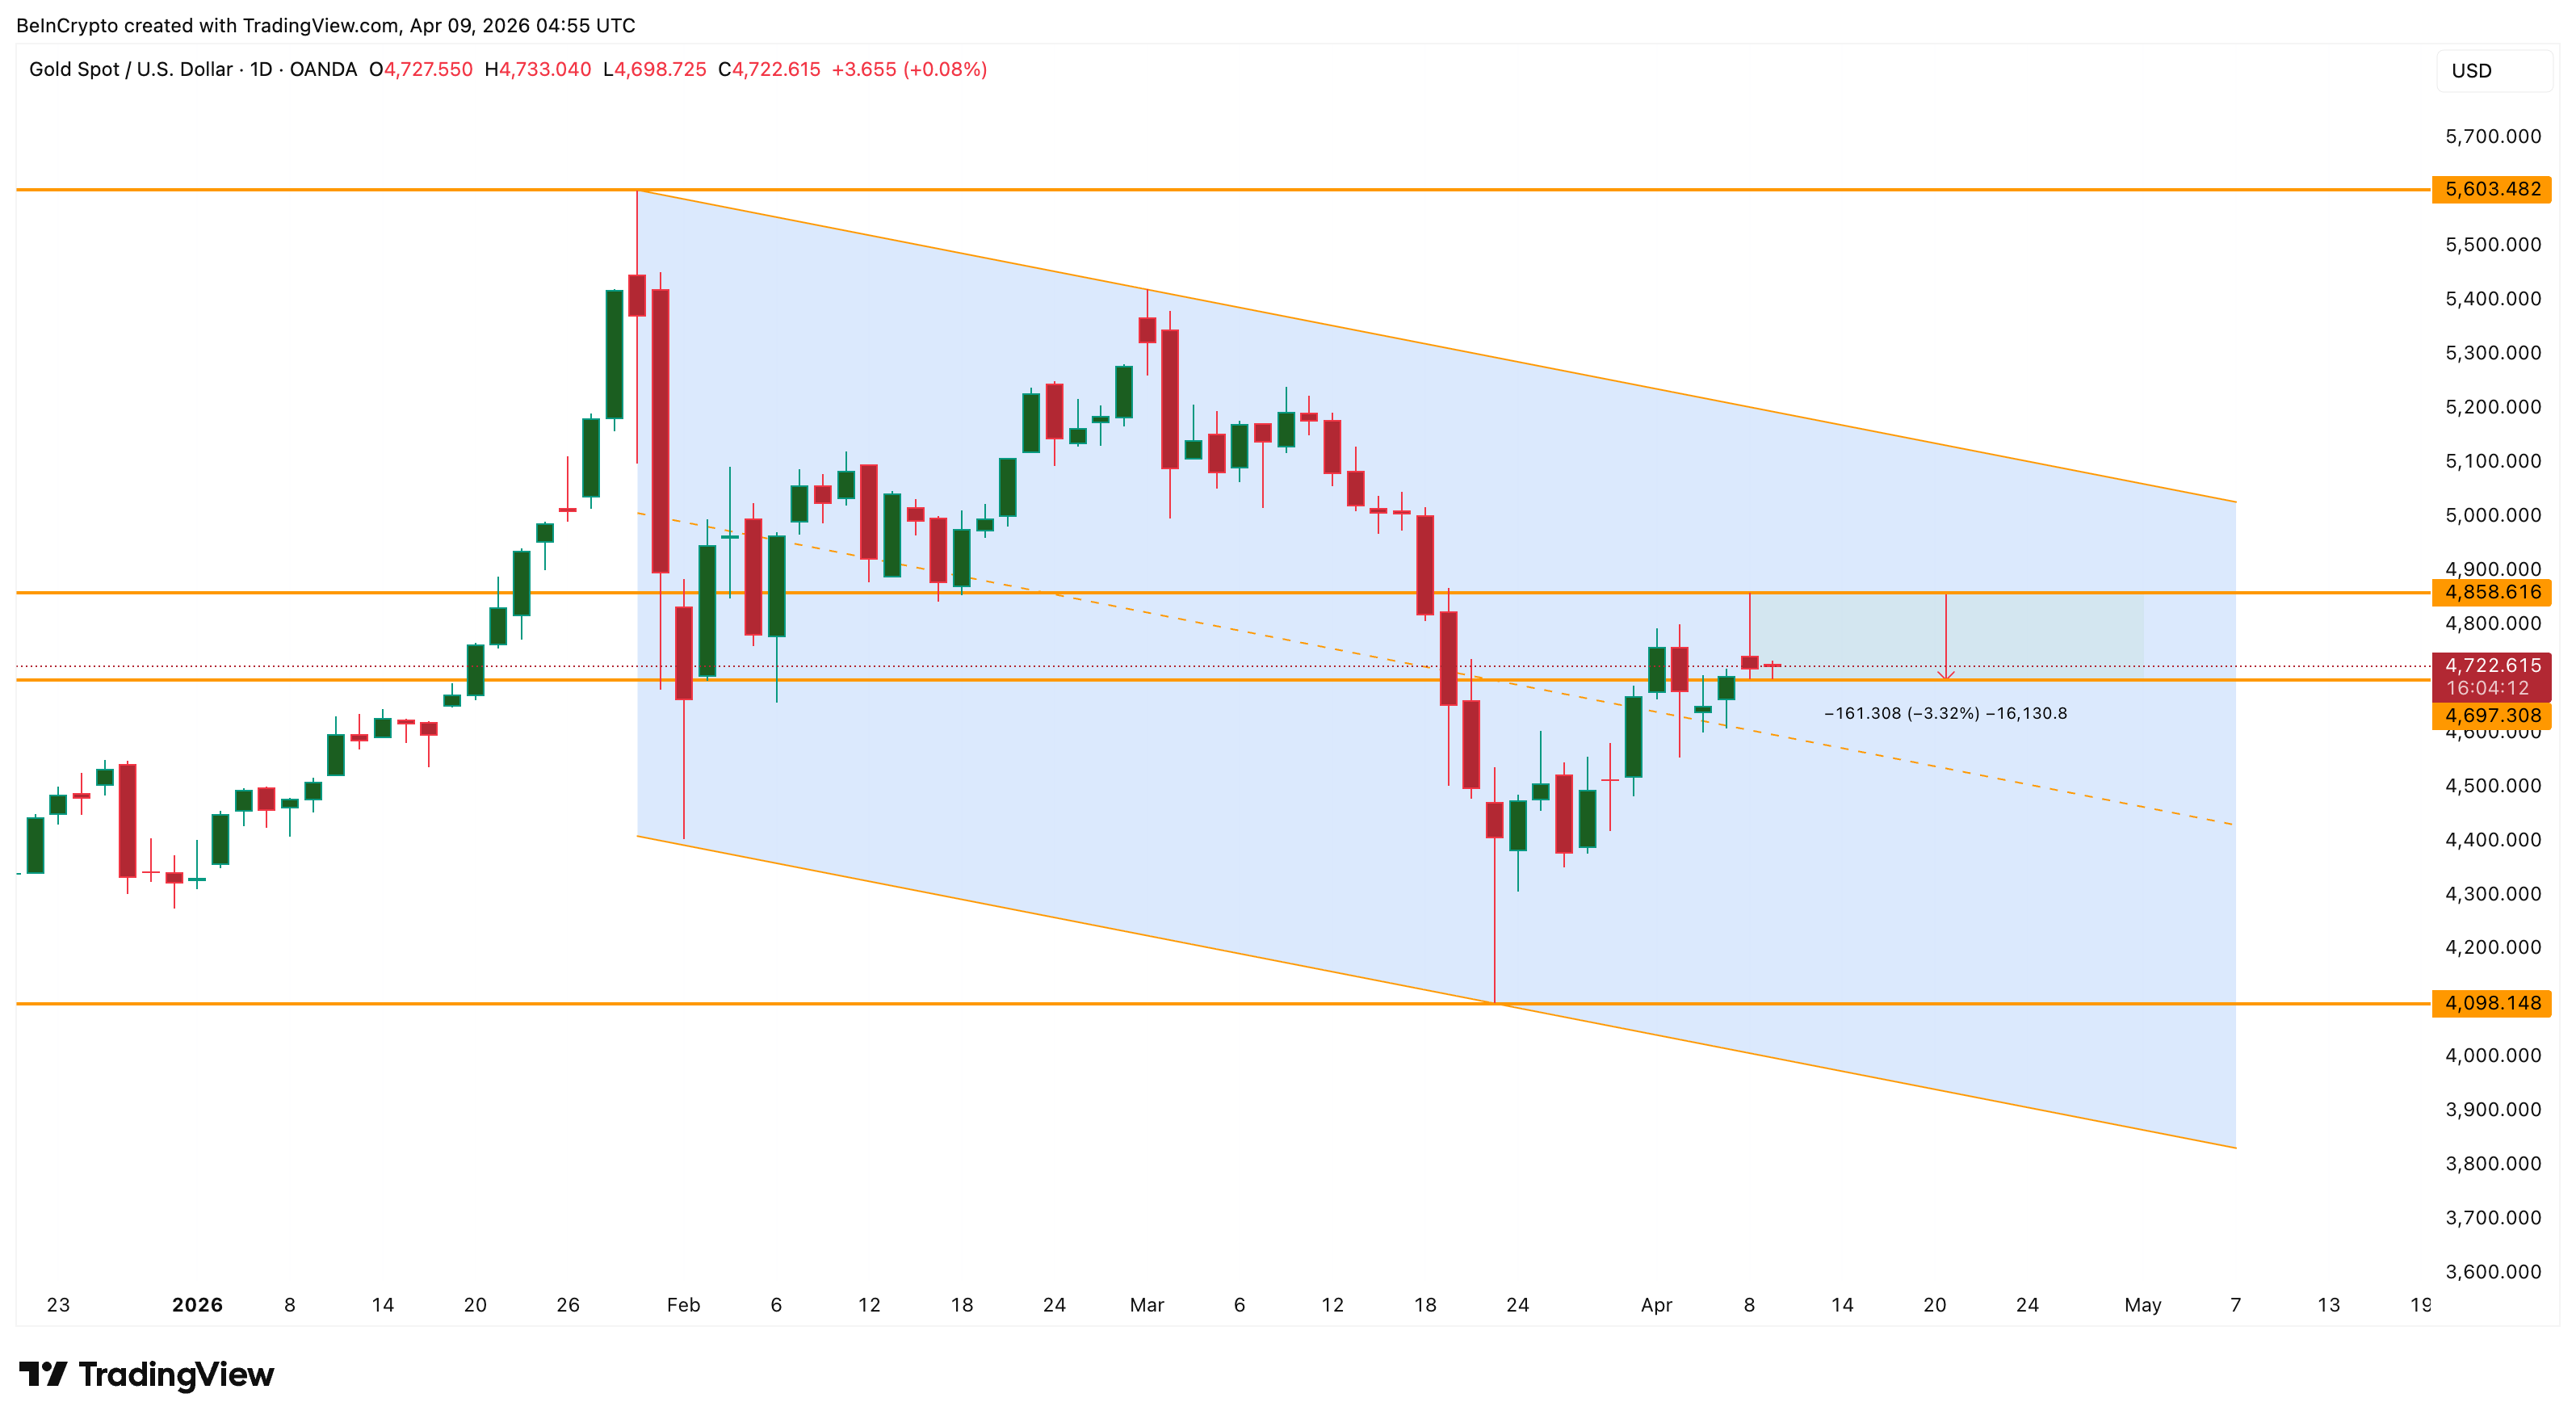
Gold (XAU/USD) price trades at $4,722 on April 9, down 3.32% from its April 8 high of $4,858 as a rebounding dollar created a short-term headwind.
The pullback arrived after the US Dollar Index (DXY) bounced 0.65% from its $98.52 low, reviving the petrodollar effect that strengthens the dollar when oil prices recover. However, a hidden bullish divergence, a potential 20-day EMA reclaim, and a bullish formation on the gold-silver ratio suggest the path beyond $5,000 remains intact for gold price despite the intraday weakness.
Gold’s Falling Channel Vs. Dollar’s Ascending Channel
Gold price has been trading inside a falling channel on the daily chart since peaking at $5,603 on January 29. The March 23 low of $4,098 marked the channel’s deepest test. The rally that followed pushed gold as high as $4,858 on April 8 before the dollar intervened.
The DXY tells the other side. The dollar has been trading inside an ascending channel for much of 2026. When the ceasefire announcement dropped on April 7, DXY fell toward $98.52, nearly breaking the lower trendline.
However, early violations of the truce and continued Strait of Hormuz uncertainty pushed oil back up, reviving the petrodollar effect. Oil-importing nations needed dollars again to pay for crude, and the DXY bounced 0.65% to $99.01.
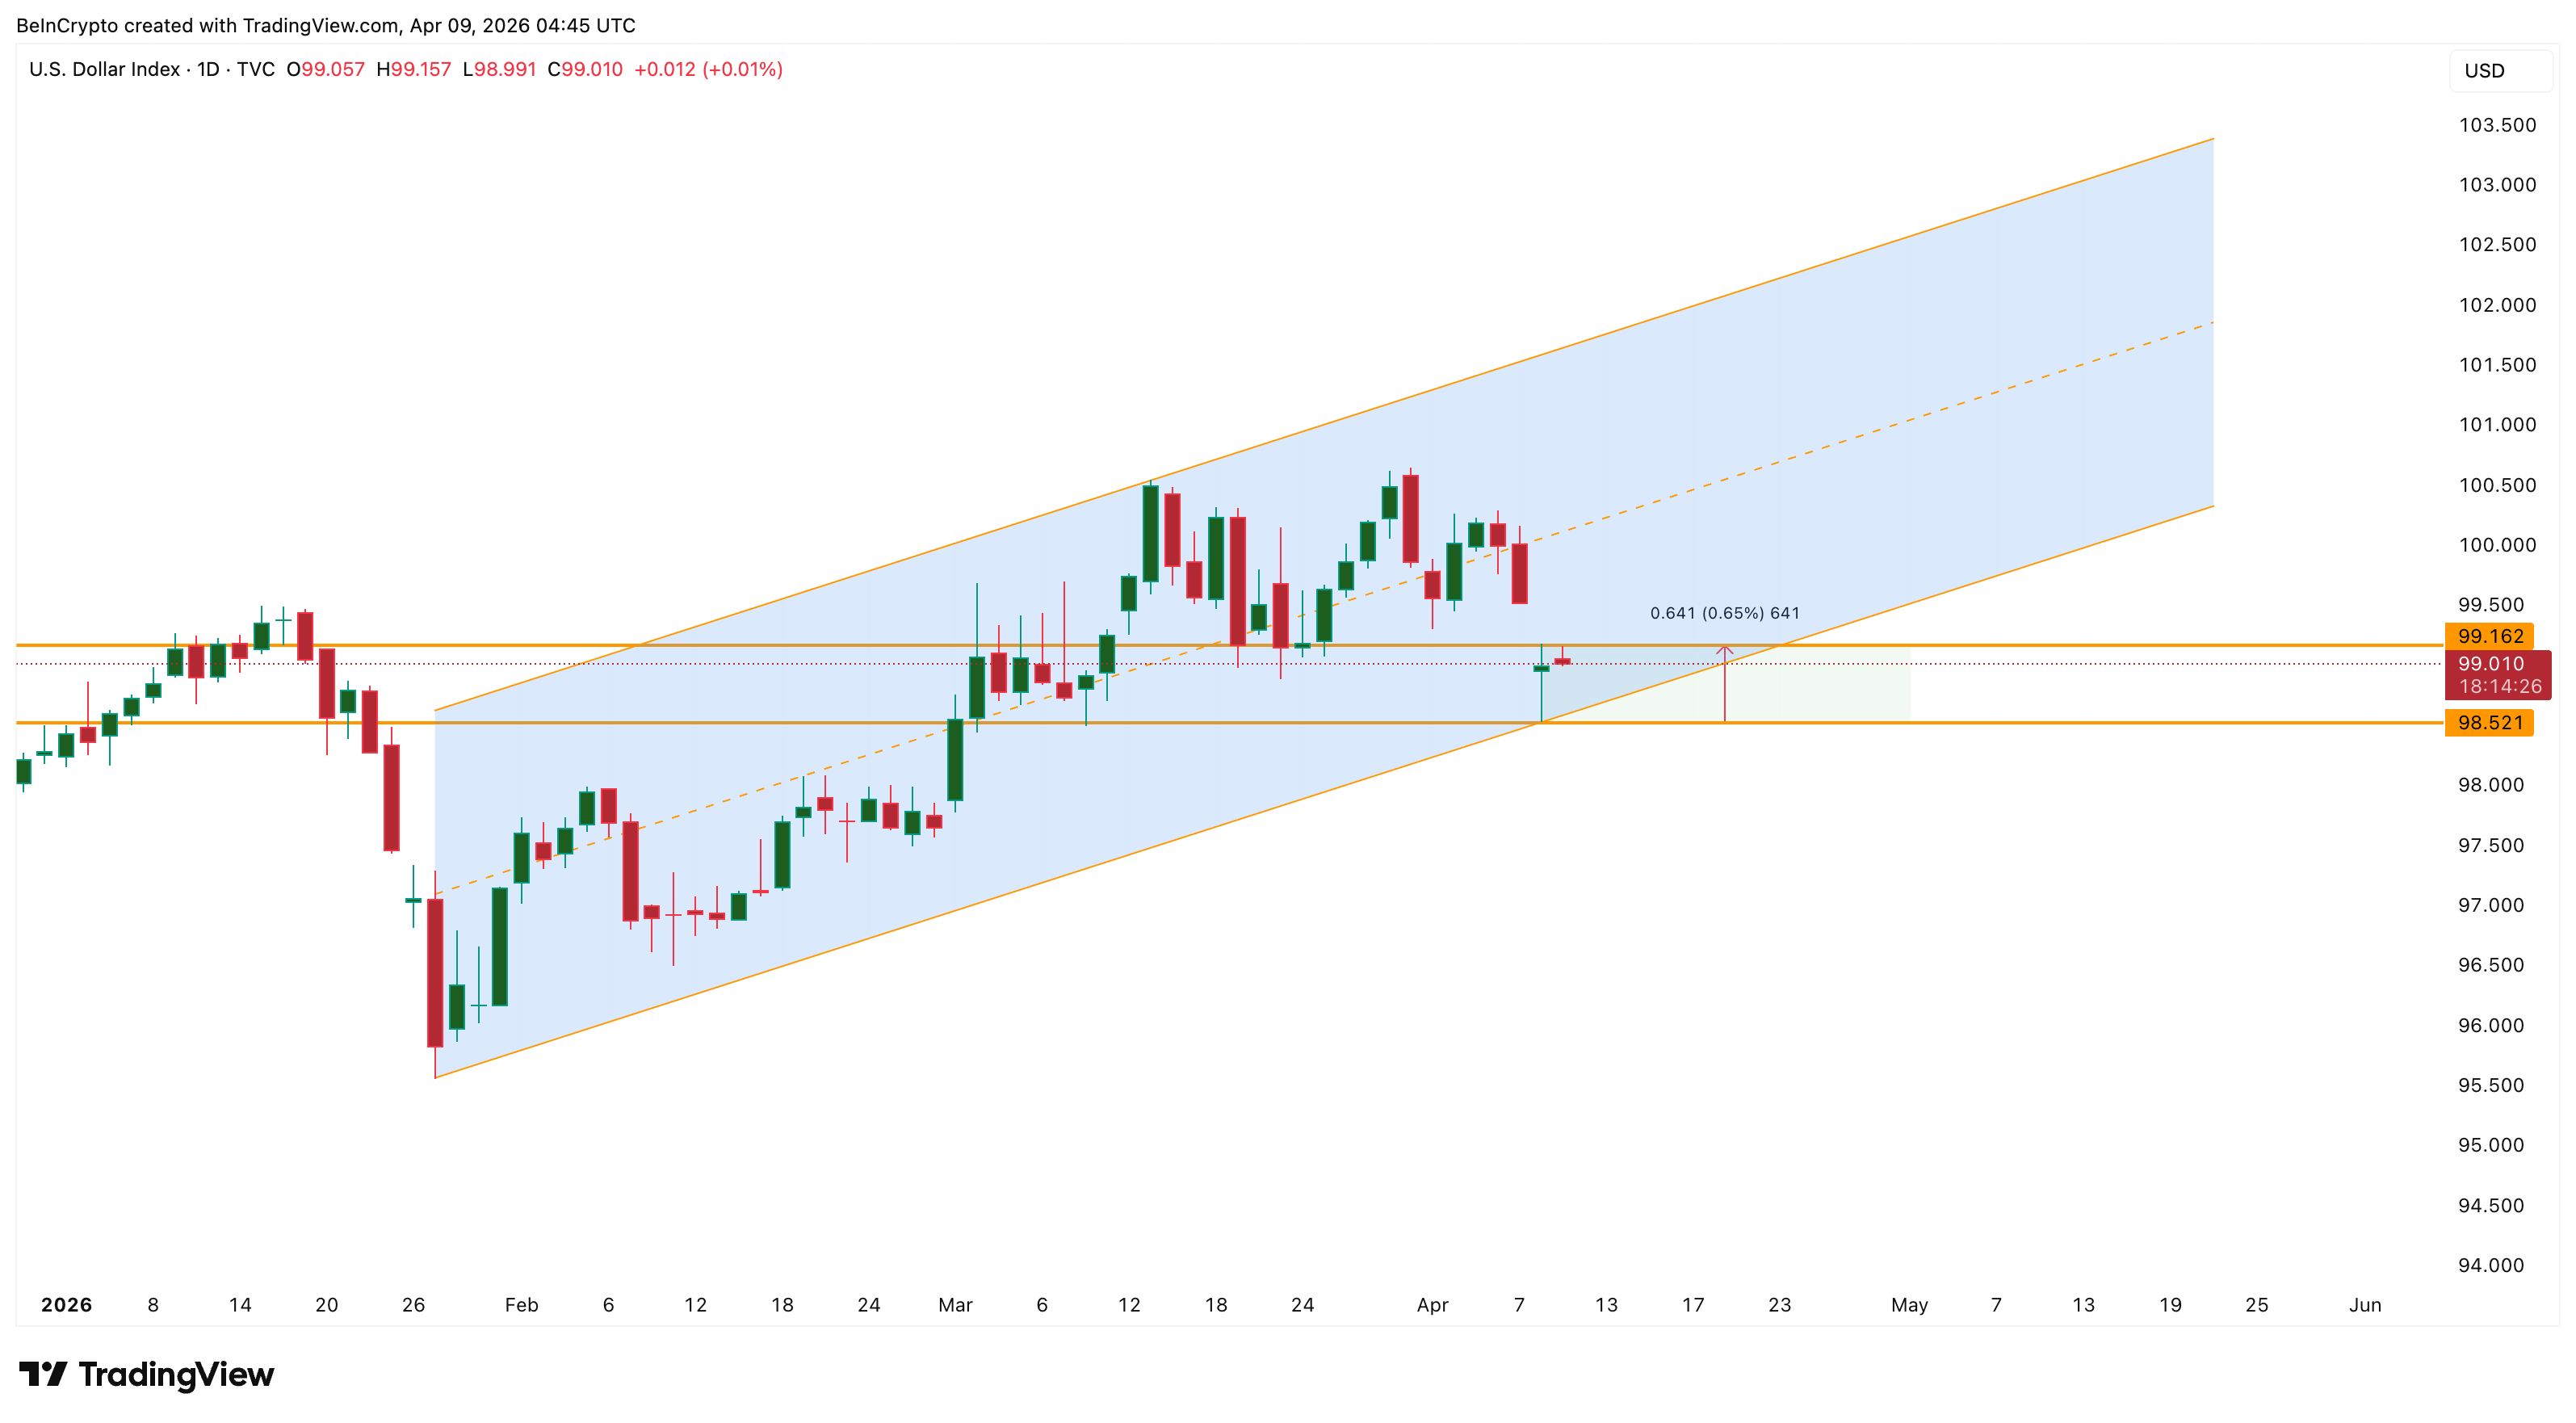
Gold and the dollar have traded inversely throughout this cycle. When the dollar weakens, gold strengthens, and vice versa. The 3.32% drop on April 8-9 is a direct product of the dollar’s bounce. For gold price to reclaim upside momentum, the DXY needs to break below $98.52 and exit its ascending channel. Until that happens, the dollar acts as a ceiling on gold rallies.
The dollar headwind is real, but it may be temporary. Two signals on the daily chart suggest the broader uptrend from March 23 is not over.
RSI Divergence and EMA Signal Build the Bullish Case
Between February 2 and April 2, gold price made a higher low on the daily chart while the Relative Strength Index (RSI), a momentum indicator measuring the speed of price changes, made a lower low. This is a hidden bullish divergence, a signal that the uptrend which began on March 23 may continue despite the surface-level pullback.
The divergence remains valid because gold has not broken below its latest swing low of $4,557. As long as that level holds, the bullish signal stays active.
The Exponential Moving Average (EMA), a trend indicator that gives greater weight to recent price movements, adds to the case. The 20-day EMA sits at $4,721, almost exactly where gold trades now. The 50-day EMA sits at $4,780. Gold already crossed above the 100-day EMA at $4,633 during the rally from the March 23 low, and it has held above it since.
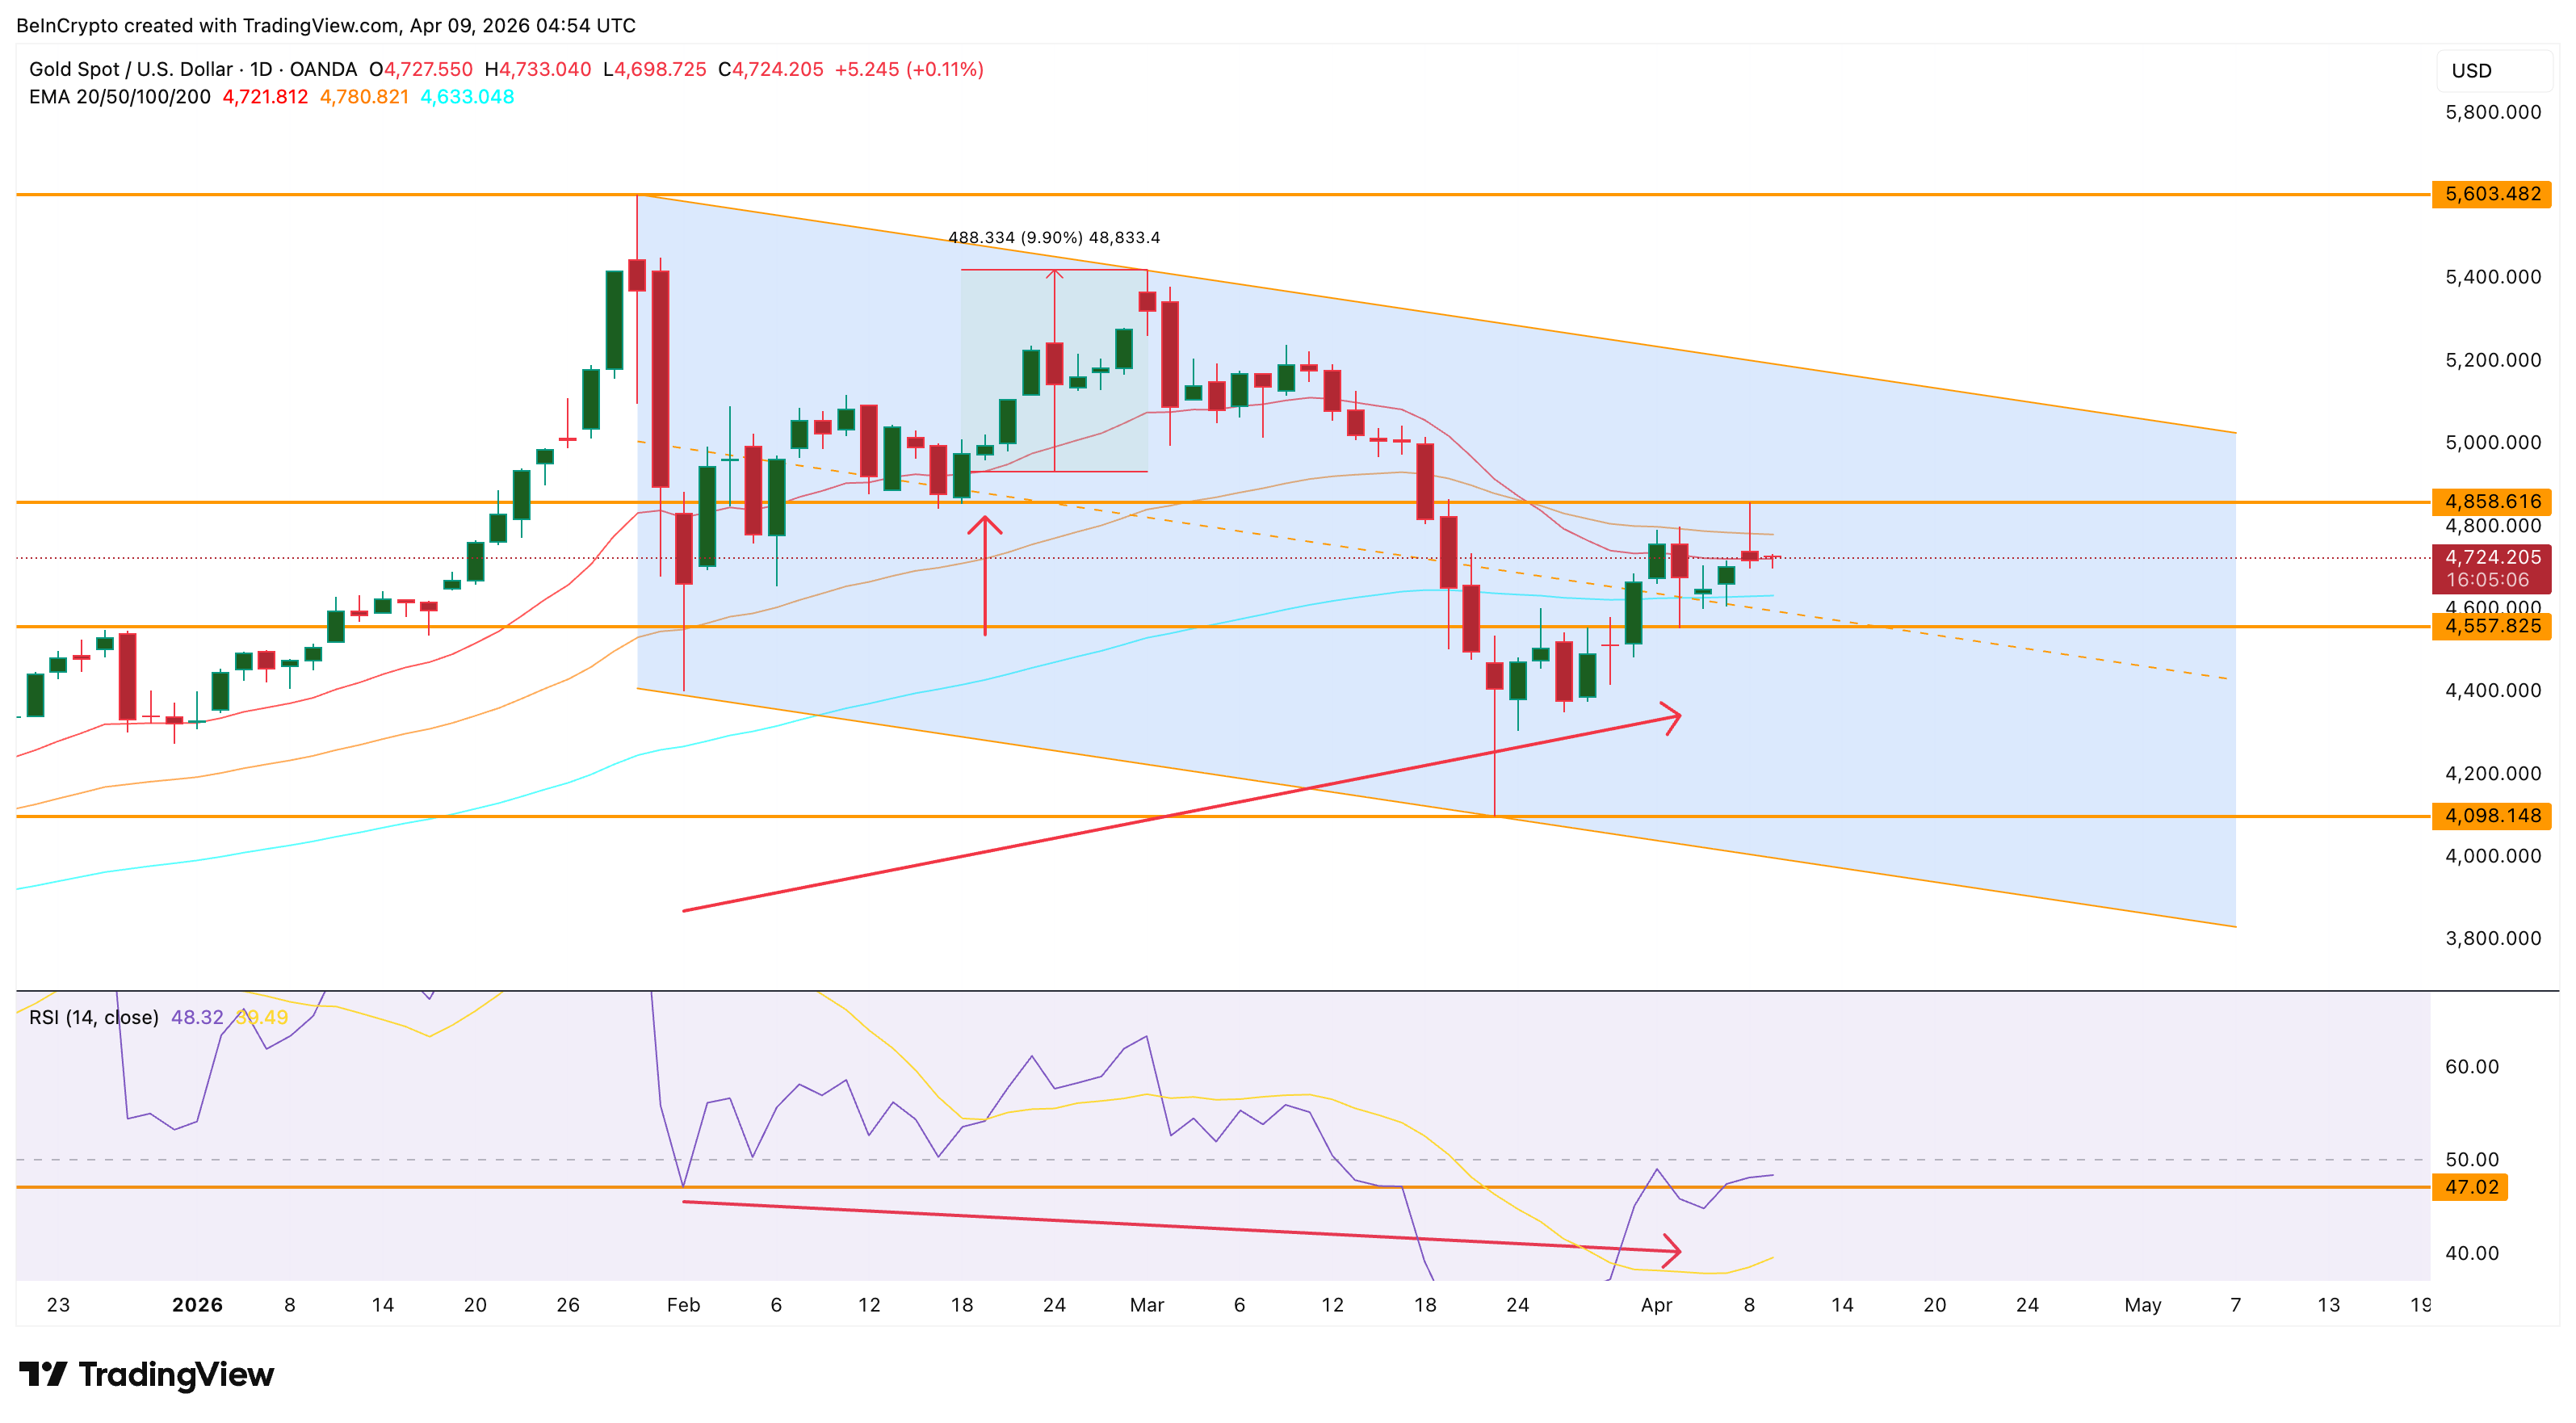
The last time gold cleanly reclaimed the 20-day EMA was February 18. The rally that followed delivered roughly 10% in gains before stalling. A similar reclaim now could set up a comparable move.
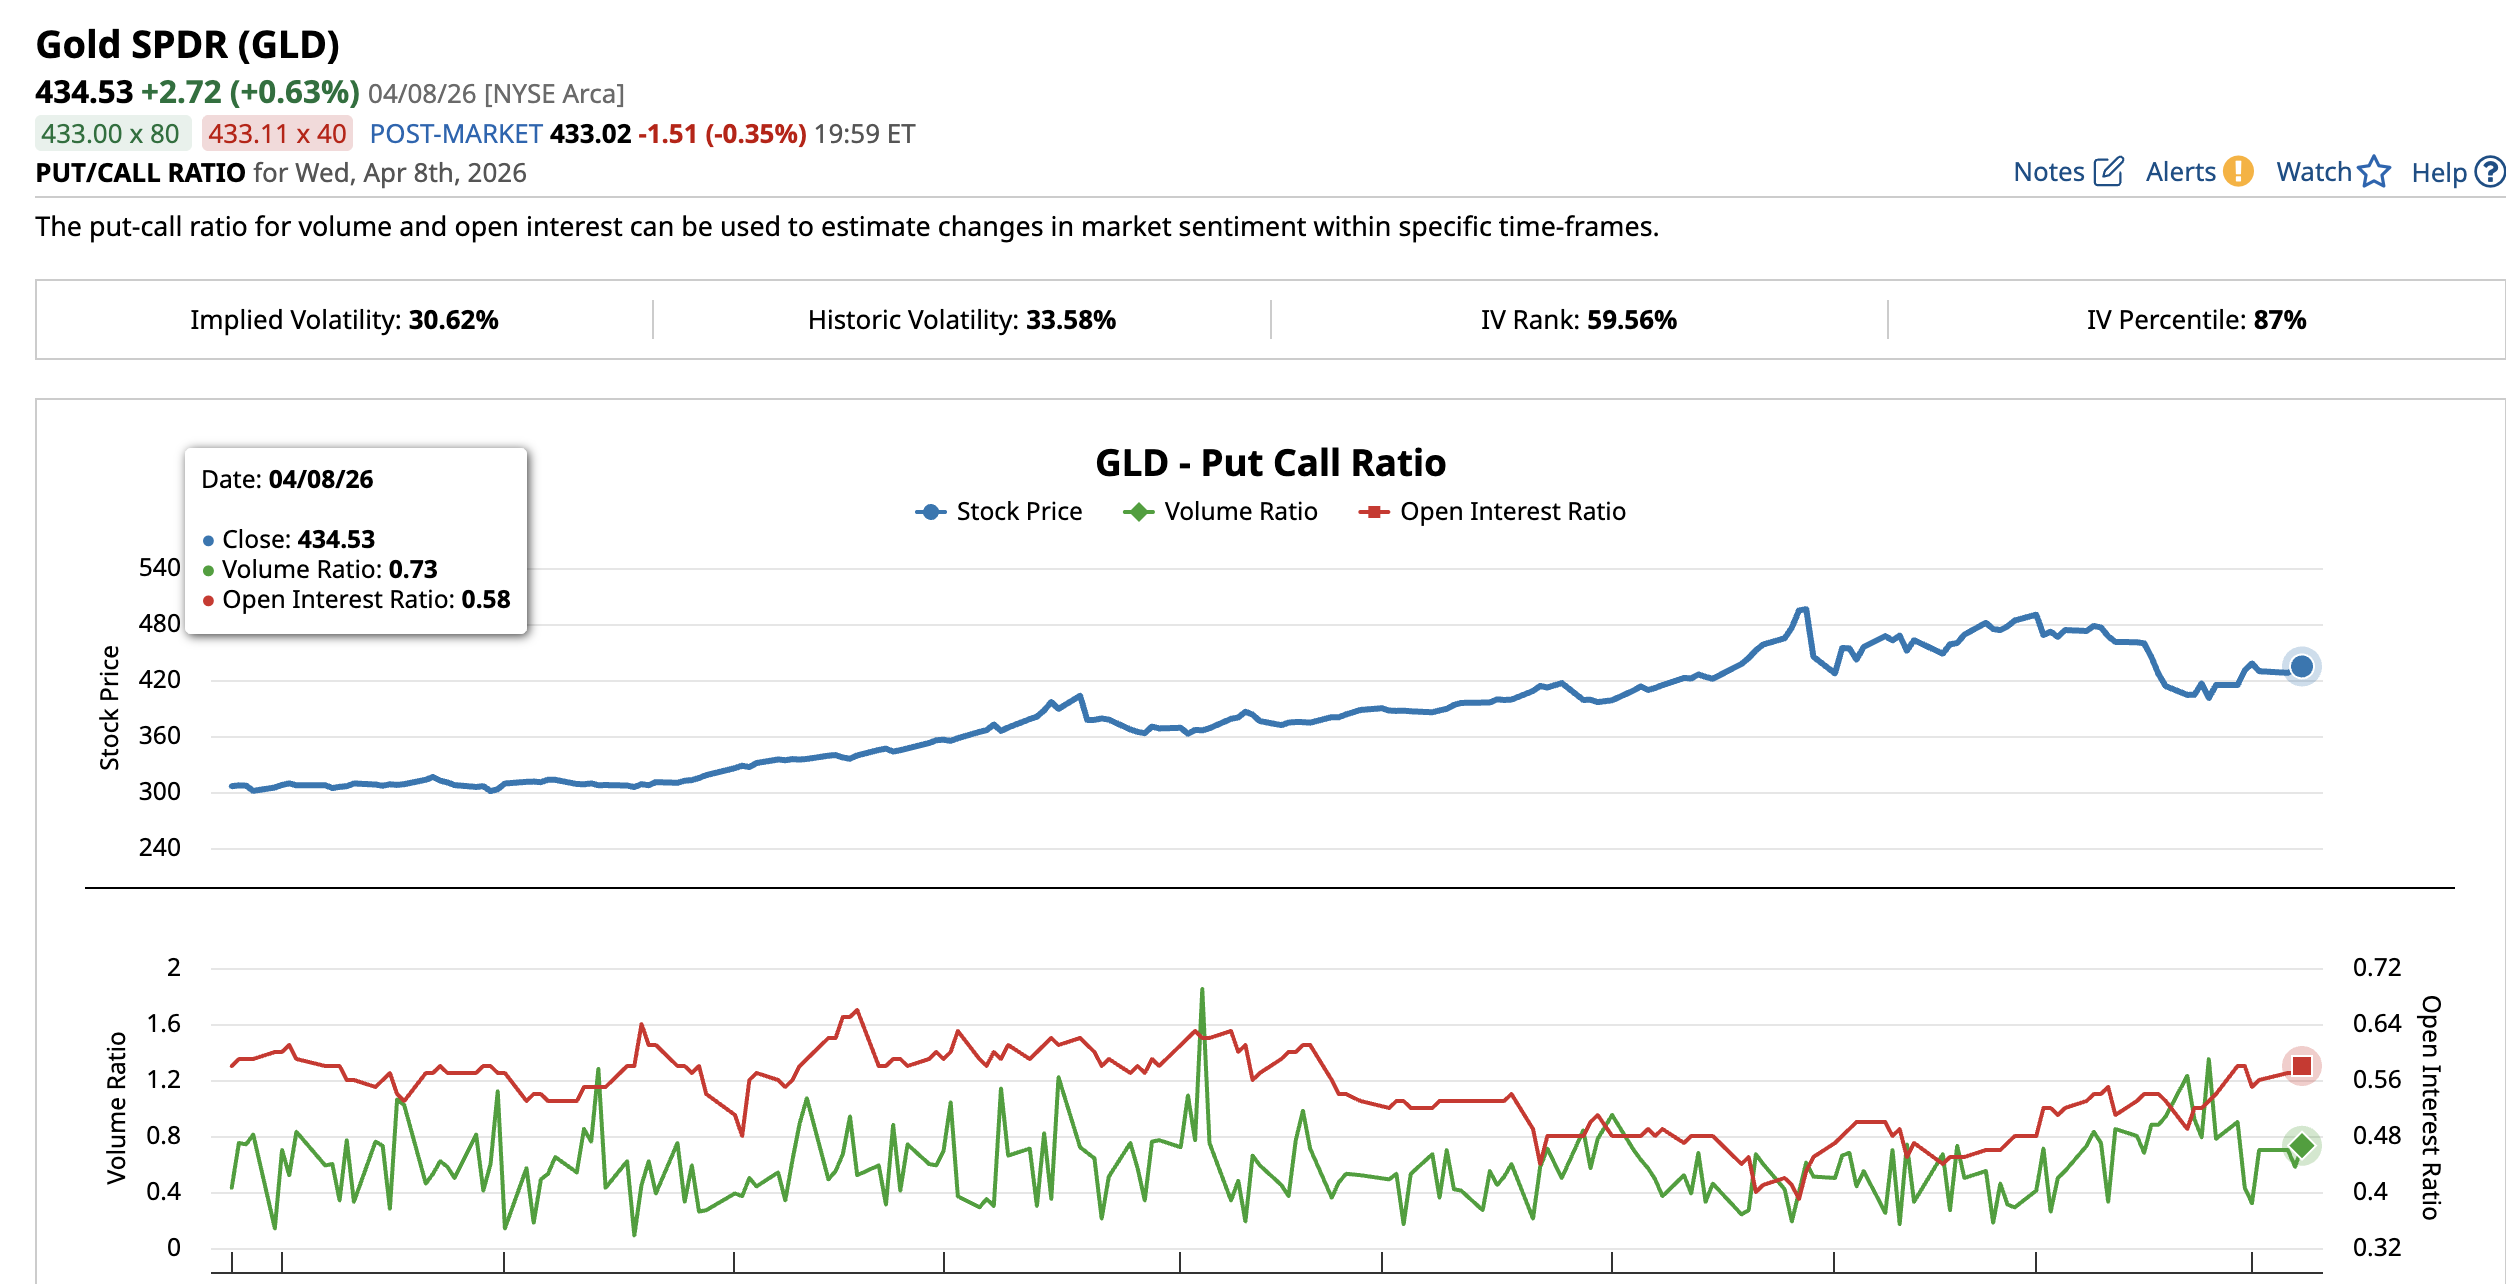
The SPDR Gold Shares (GLD) put-call ratio, a measure of options sentiment on the largest gold-backed ETF, shows mild hedging rather than panic. The volume ratio rose from 0.58 on April 7 to 0.73 on April 8. The open interest ratio edged up from 0.57 to 0.58. Both readings remain below 1.0, meaning calls still outpace puts. The slight increase reflects traders adding protective positions after the drop, not a bearish conviction shift.
The RSI divergence and EMA approach both lean bullish. But gold’s ability to outperform depends not just on its own chart but on how it performs relative to silver. The gold-silver ratio provides that final layer.
Gold-Silver Ratio Builds Bullish Structure as Gold Eyes Outperformance
The gold-silver ratio (XAU/XAG) trades at 63.70 and is forming an inverse head and shoulders pattern on the daily chart. A rising ratio means gold is gaining strength relative to silver.
The key levels for the ratio sit at 69.50 at the 0.618 level and 71.72 at the 0.786 level. A breakout above 69.50 would confirm the pattern and push the ratio toward 74.56 at the 1.0 level. A ratio at 74 would mean gold is outperforming silver by a significant margin, attracting capital from silver into gold as a preferred store of value.
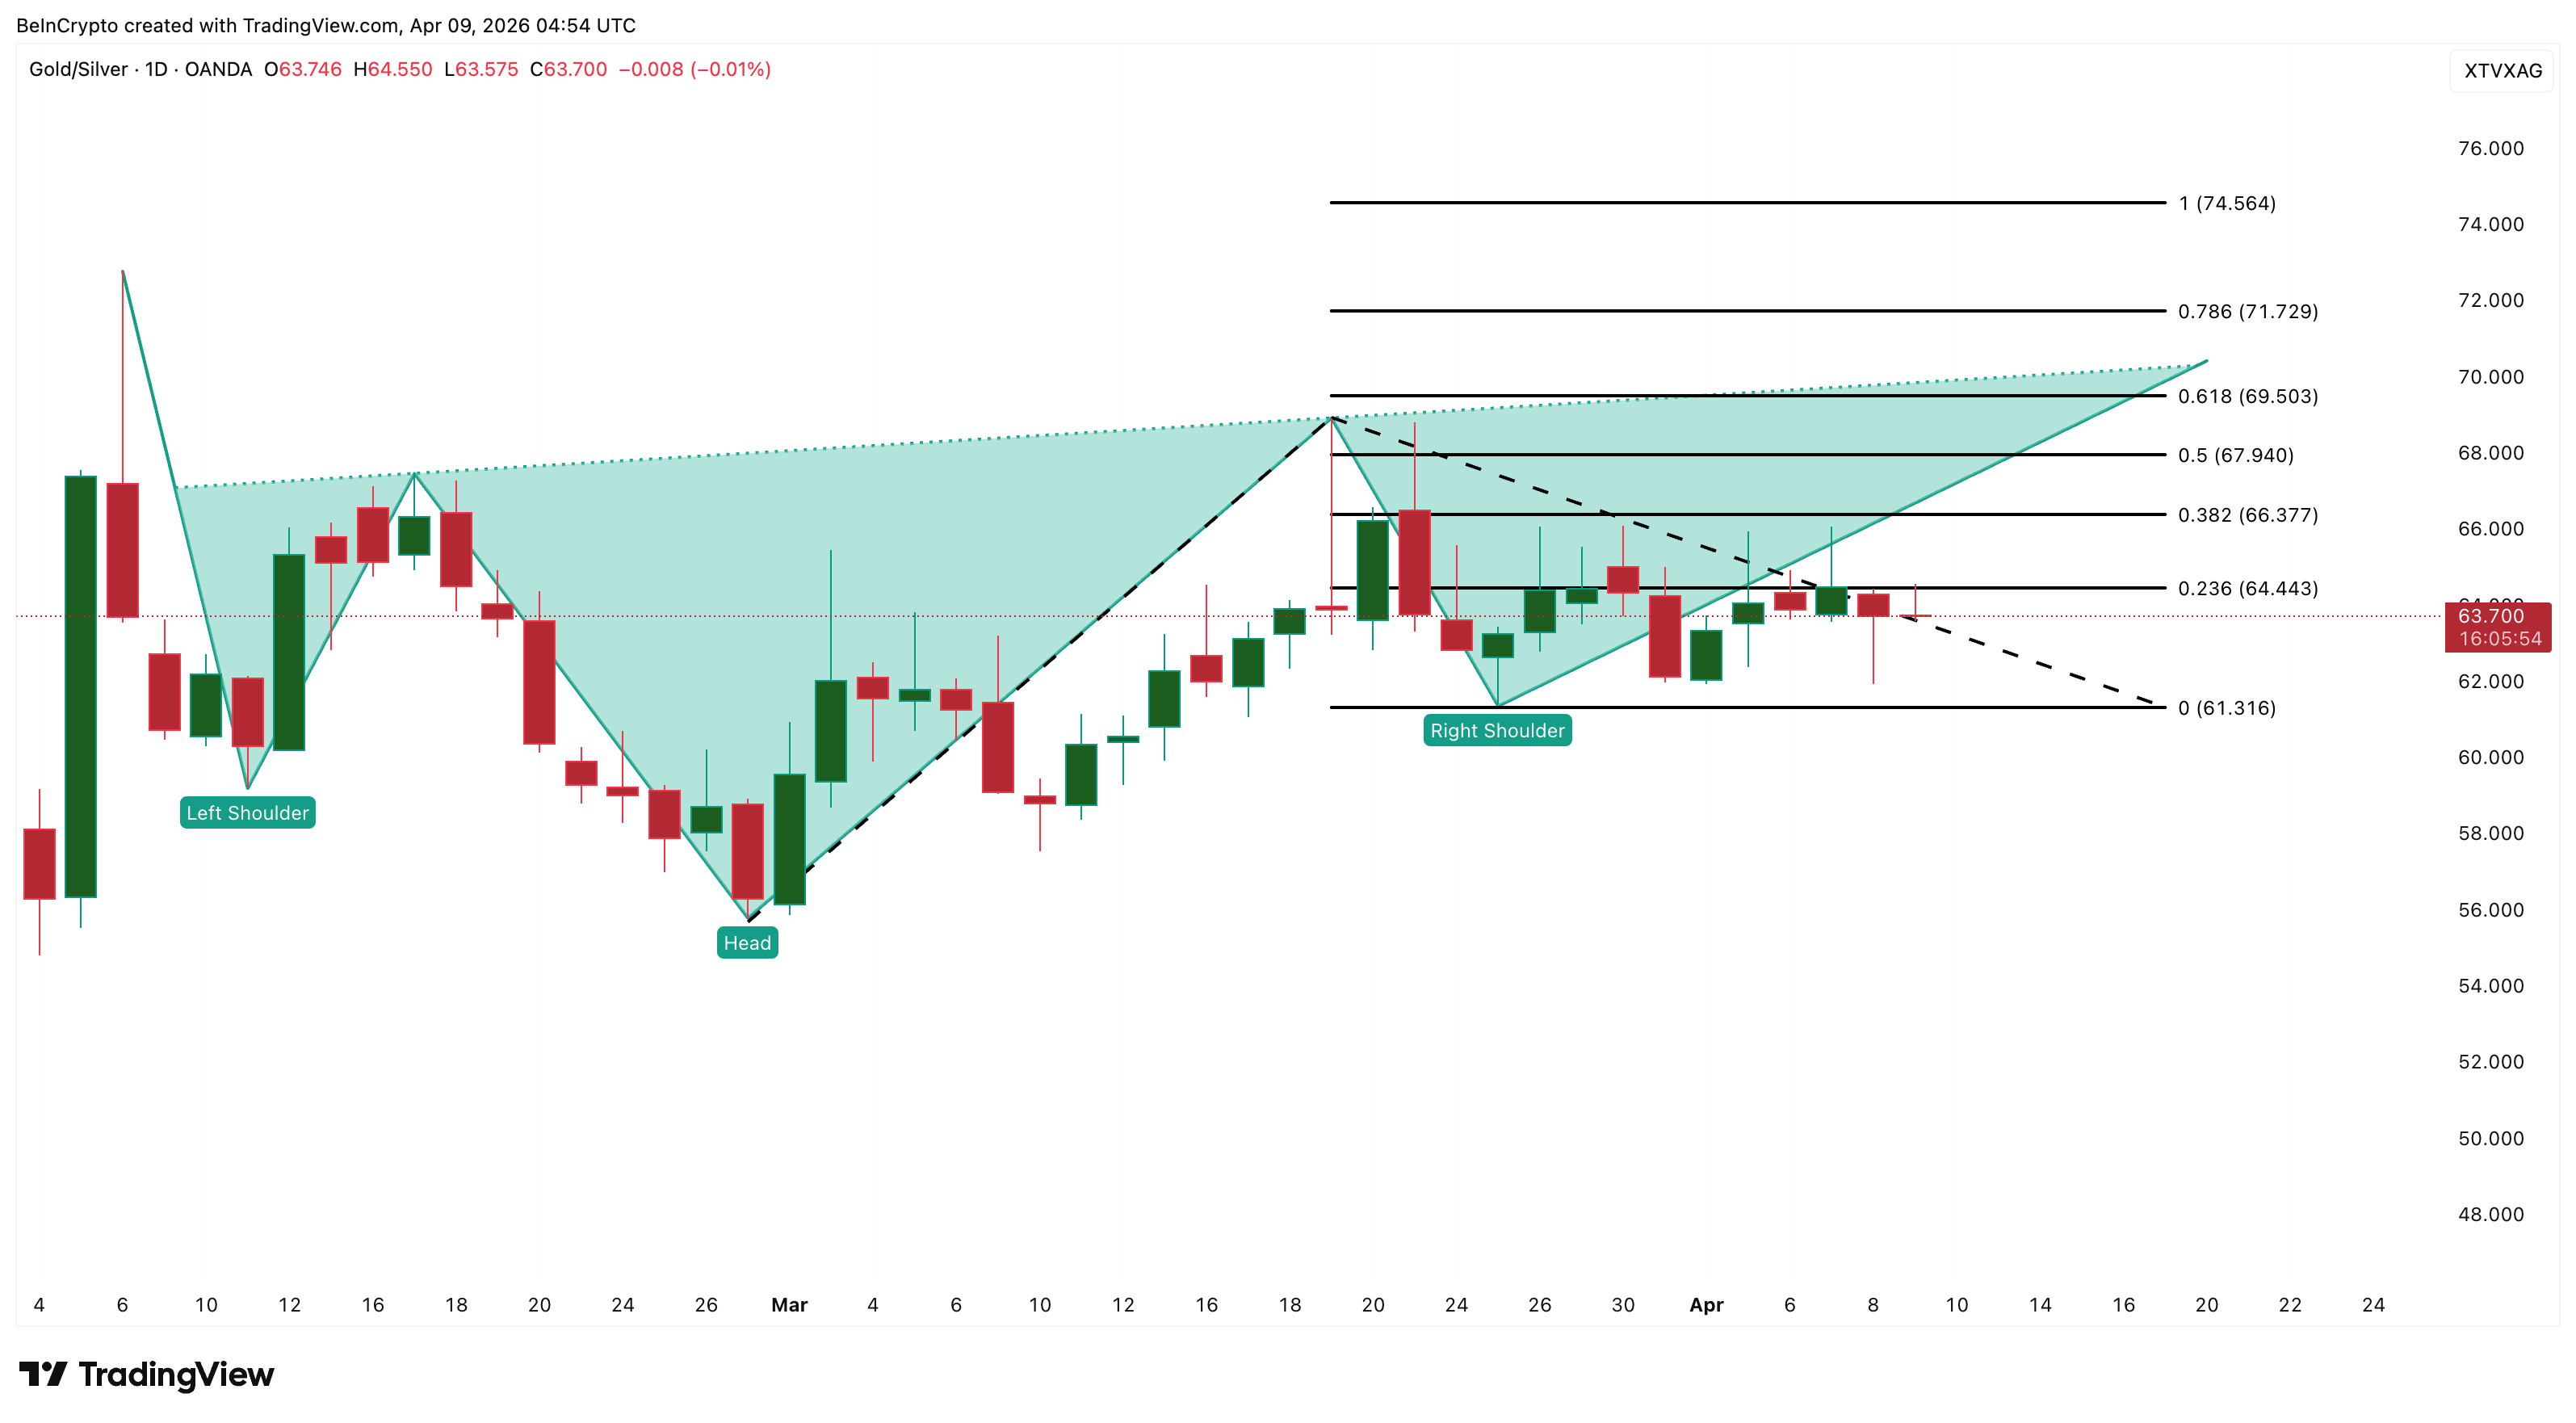
This matters for gold price because even if the dollar stays strong and both metals weaken, gold would lose less than silver. In a scenario where the dollar breaks its channel and both metals rally, gold would rally harder. Either way, the ratio favors gold.
With the divergence, EMA reclaim potential, and a bullish ratio structure all pointing the same way, the price chart becomes critical.
Gold Price Levels That Determine if $5,000 Is Reachable
Gold trades at $4,722. The critical resistance sits at $4,852 at the 0.5 Fibonacci level, just 2.72% above the current price. This is the level where the April 8 rally was rejected. A daily close above $4,852 would confirm a breakout and bring the $5,000 zone into focus.
Above $4,852, the 0.618 level at $5,030 is the first target (the $5,000 zone). A sustained move higher opens the path toward $5,283 at the 0.786 level and eventually $5,605 near the January 29 peak. For these targets to become realistic, the DXY must break below $98.52 and the gold-silver ratio must continue rising above 69.50.
On the downside, $4,674 at the 0.382 level is the first support. Below that, $4,455 at the 0.236 level comes into play. The March 23 low of $4,098 remains the floor. A break below the swing low of $4,557 (from earlier) would invalidate the RSI divergence and shift the short-term bias bearish.
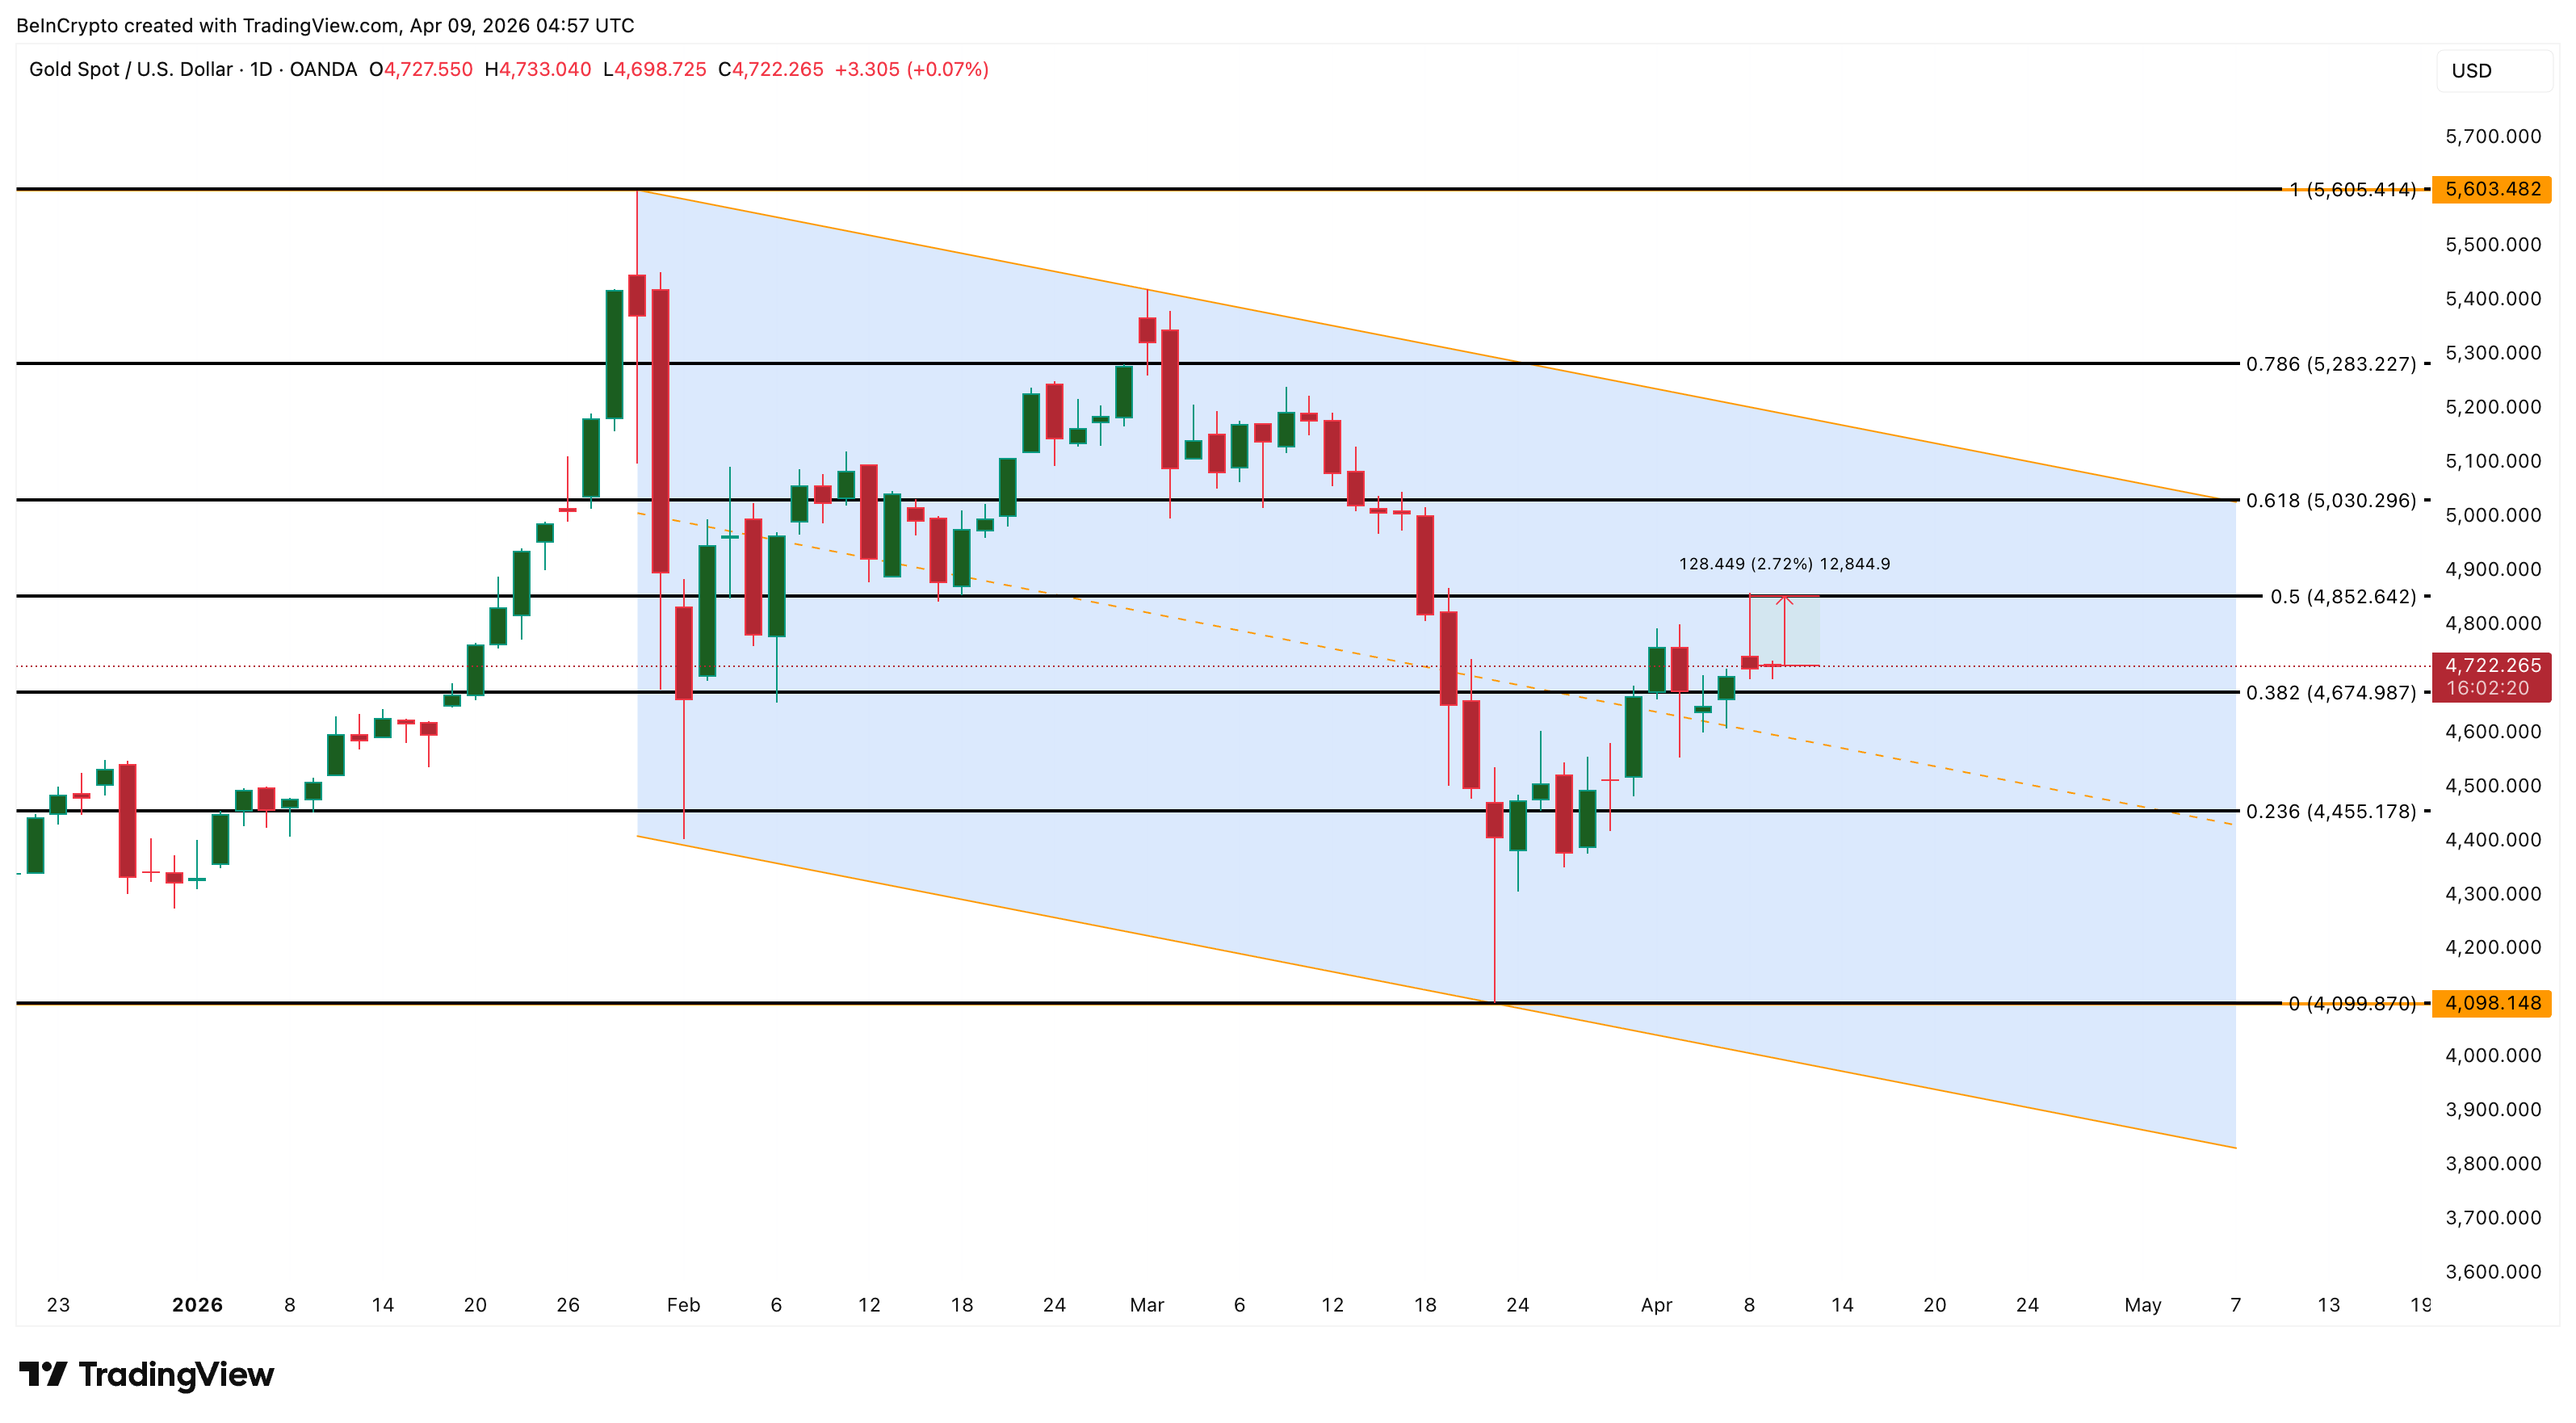
Per the current chart, $4,852 separates a confirmed breakout toward the $5,000 zone from a continued pullback toward $4,674 and a potential retest of the $4,455 support.
* The content presented above, whether from a third party or not, is considered as general advice only. This article should not be construed as containing investment advice, investment recommendations, an offer of or solicitation for any transactions in financial instruments.


