




$100 Oil Is Back — And This Time, a U.S. Naval Blockade Is Fuelling the Fire


Brent crude surges 7.9% as the U.S. enforces a maritime blockade on Iranian ports.
This created one of the most volatile and geopolitically charged oil setups in recent memory.
Washington Just Pulled the Trigger — And Oil Markets Are on Fire
Brent crude oil is at a critical inflection point. After a dramatic spike to $115-$116 per barrel in mid-March, the price spent three weeks grinding lower before today’s explosive 7.9% daily candle changed the picture entirely.
The catalyst is unambiguous. On April 13, U.S. Central Command announced enforcement of a maritime blockade on all vessels entering and exiting Iranian ports, effective immediately, applying to all ships regardless of flag or ownership across the Arabian Gulf and Gulf of Oman.
Critically, the Strait of Hormuz remains open — protecting roughly 20% of global oil supply from immediate disruption. However, the direct choking of Iranian port access tightens supply and is already driving insurance premiums higher across Gulf shipping routes.
The situation is fluid with no confirmed duration on the blockade. Iran’s parliament speaker has already hinted at retaliation, warning markets to “enjoy the current pump figures.”
The Daily Chart: A Market Waking Up From a Three-Week Hangover
From mid-October through February, Brent crude ground slowly higher between $60 and $72 (green box). Then, in late February, a violent geopolitical shock nearly doubled the price in just weeks, sending it surging to $115-$116 (red box).
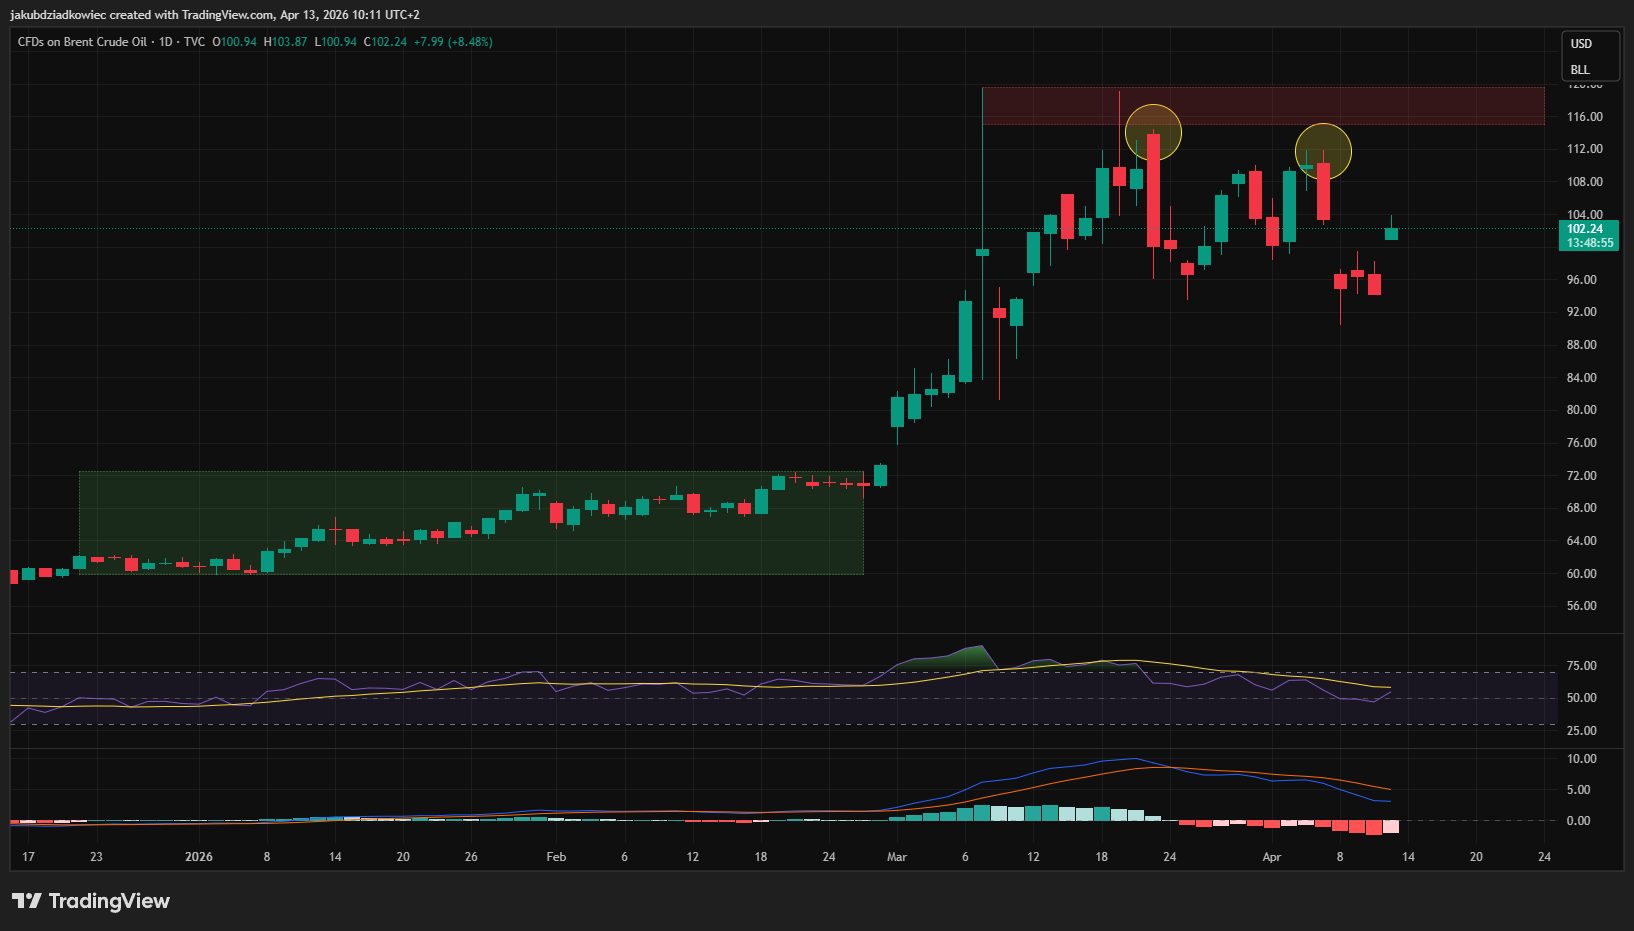
Since that peak, the daily chart has been printing lower highs (yellow circles) — a classic distribution pattern signalling weakening momentum. The daily MACD remains below zero with bearish histogram bars, and RSI sits in neutral territory around 55-60, well below the overbought readings seen during the March spike.
Today’s candle is significant and cannot be ignored. But the daily trend has not fully recovered yet, and the MACD has not crossed bullish — meaning this rally still needs confirmation.
The 4-Hour Chart: Short-Term Bulls Are Stepping In
Zooming into the 4-hour timeframe, the picture is more constructive. The MACD has just crossed bullish with a growing green histogram (yellow circle), and RSI is recovering strongly from near-oversold levels visited around April 7-8 (blue ellipse).
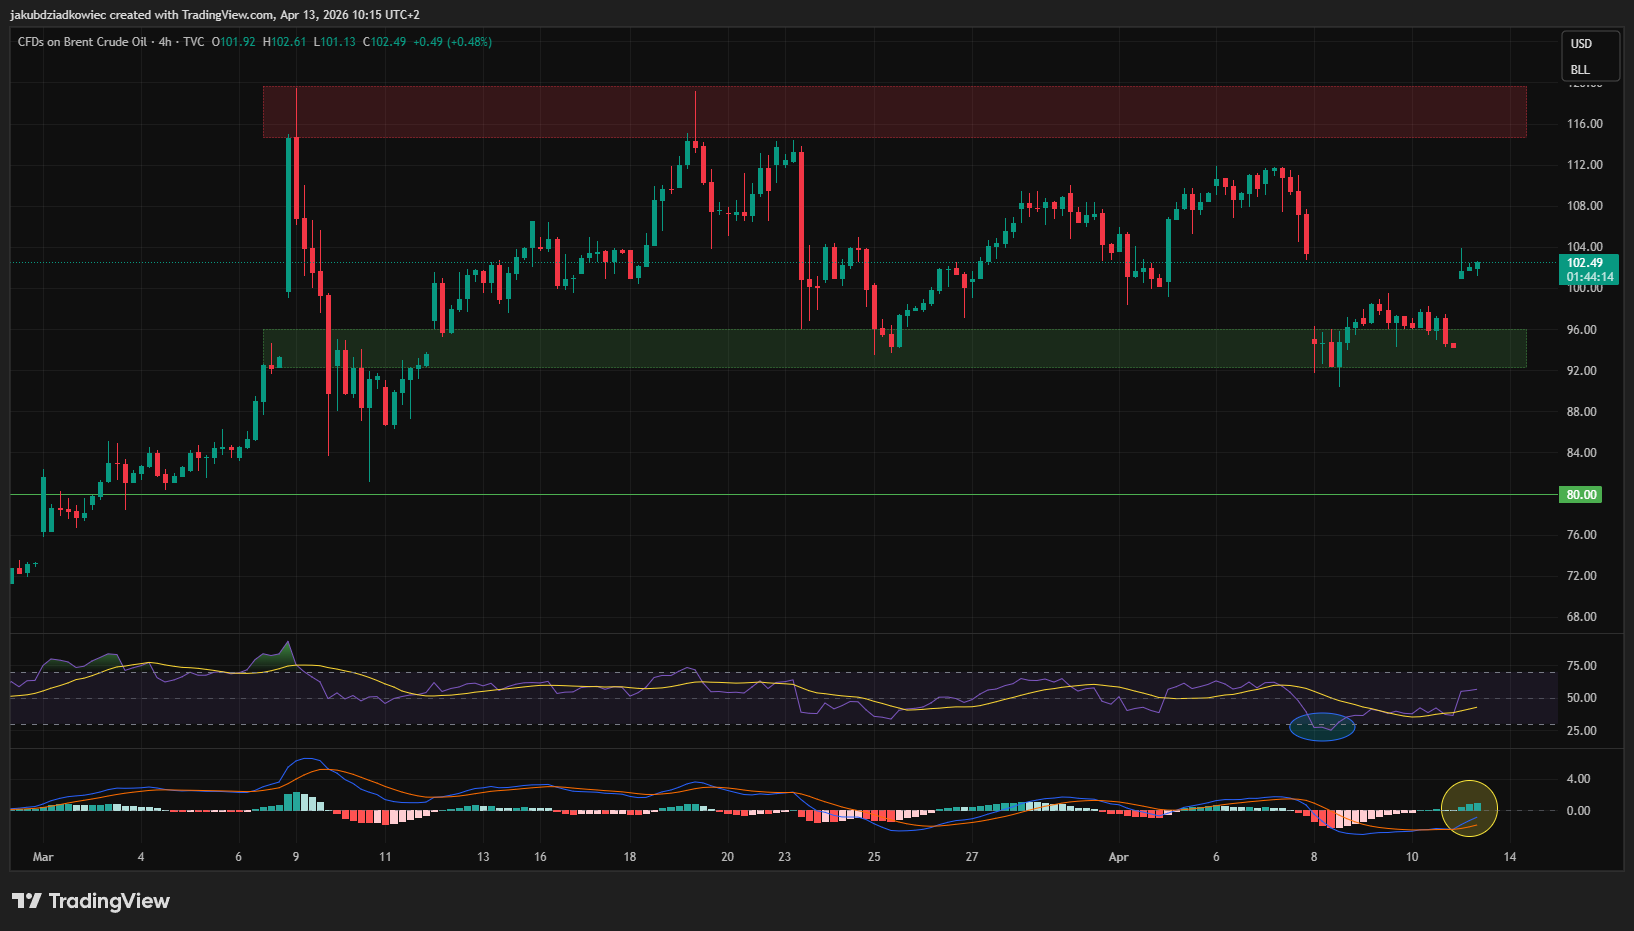
This short-term momentum shift is consistent with today’s geopolitical catalyst. However, it is playing out within a larger bearish structure on the daily — a classic bounce within a downtrend until proven otherwise.
Three resistance zones define the upside. The immediate battleground sits at $103-$105, where the price is trading right now. Above that, $108-$110 represents the next significant ceiling, with the $113-$116 spike high as major resistance beyond (red box).
On the downside, $93-$96 is the most critical support zone (green box) — it has held multiple times and is the line bulls cannot afford to lose. Below that, $78-$80 represents the last major structural support and the pre-shock baseline.
The wildcard is pure headline risk. This market is reacting violently to news flow in both directions, and no technical setup can fully account for a surprise Iranian retaliation or an unexpected diplomatic breakthrough. Caution and awareness of the news cycle are as important as any chart level right now.
Disclaimer: The content presented above, whether from a third party or not, is considered as general advice only. CFD trading involves significant risk of loss. Past performance does not guarantee future results. This article serves informational purposes only and does not constitute financial advice. Consider your risk tolerance before trading.


