


Ripple Price Forecast: XRP extends bullish momentum as sentiment improves
- XRP edges higher for the fourth consecutive day, trading above $1.47 on Monday.
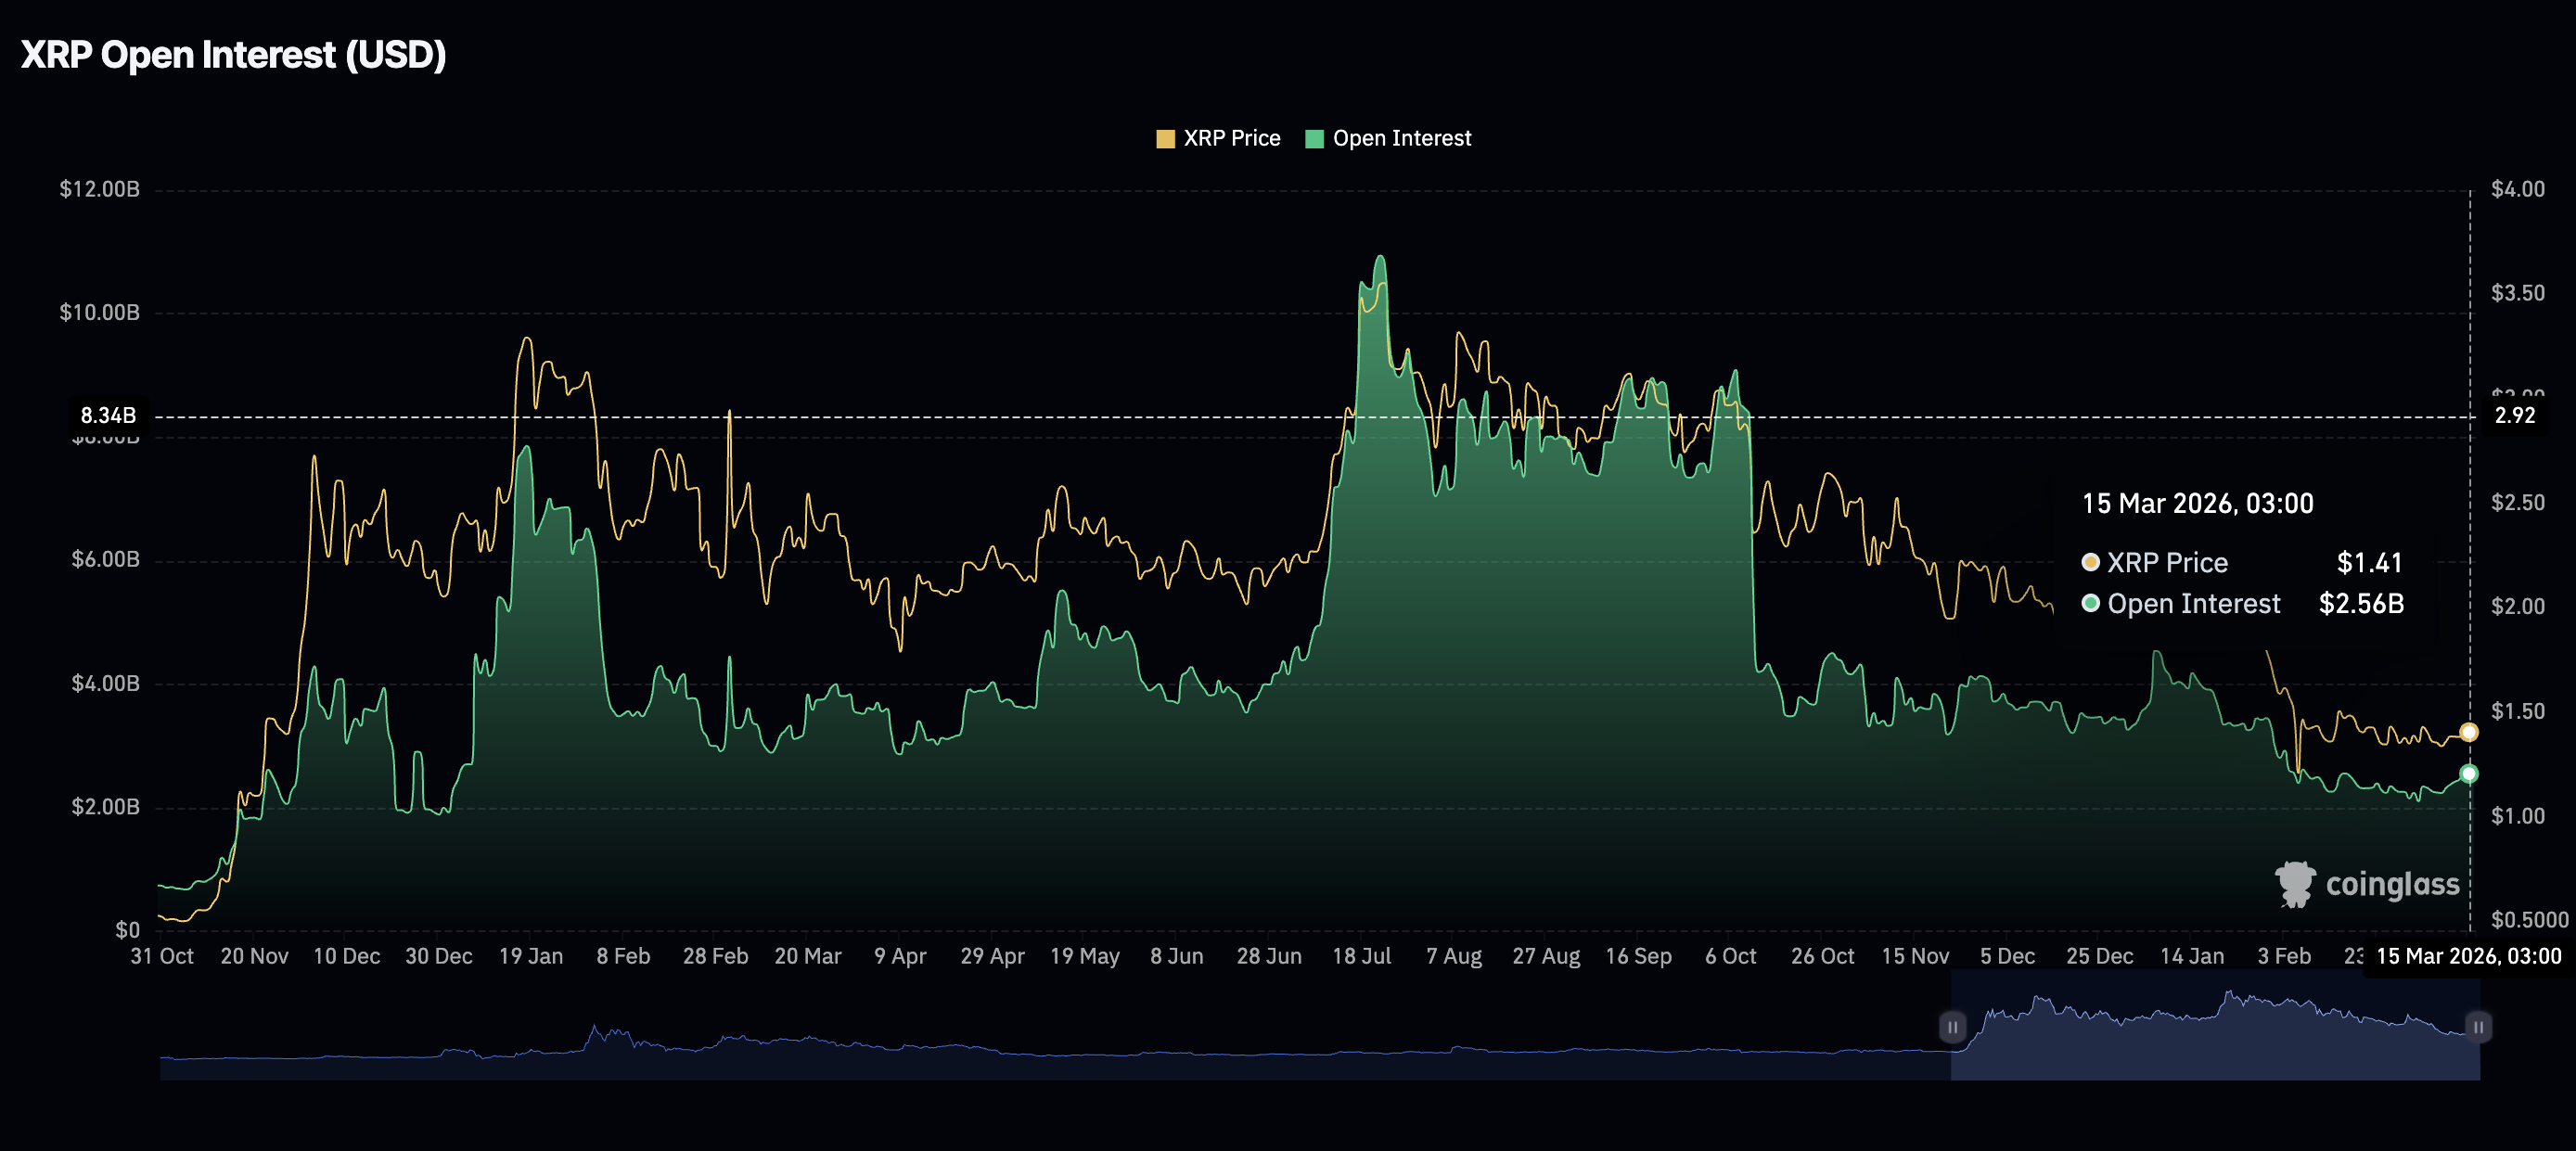
- Retail interest steadies with futures Open Interest expanding to $2.66 billion.
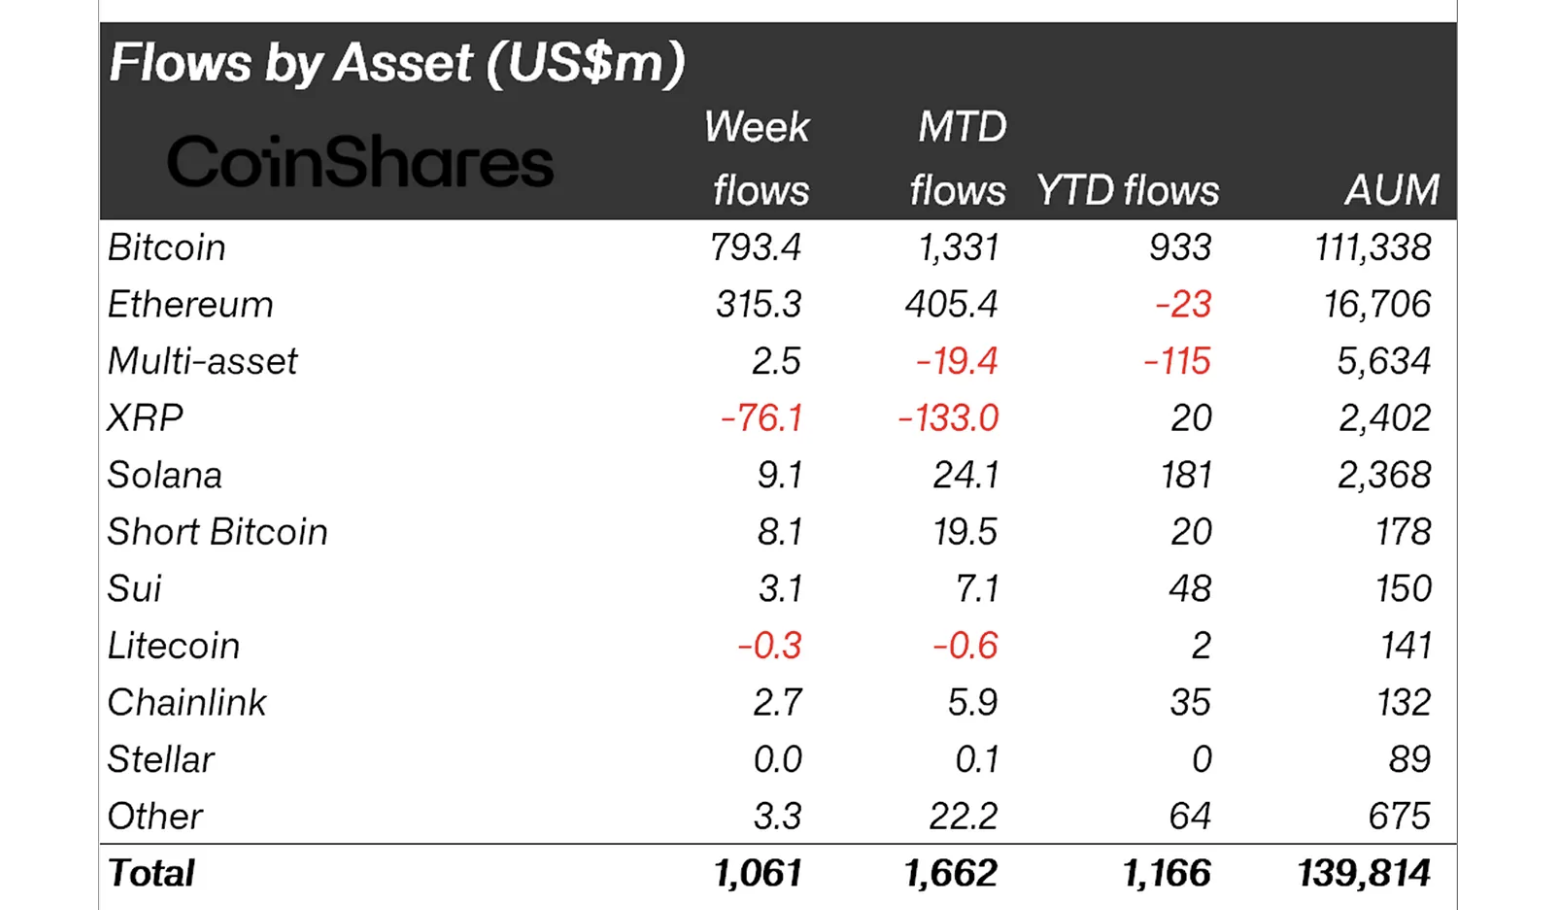
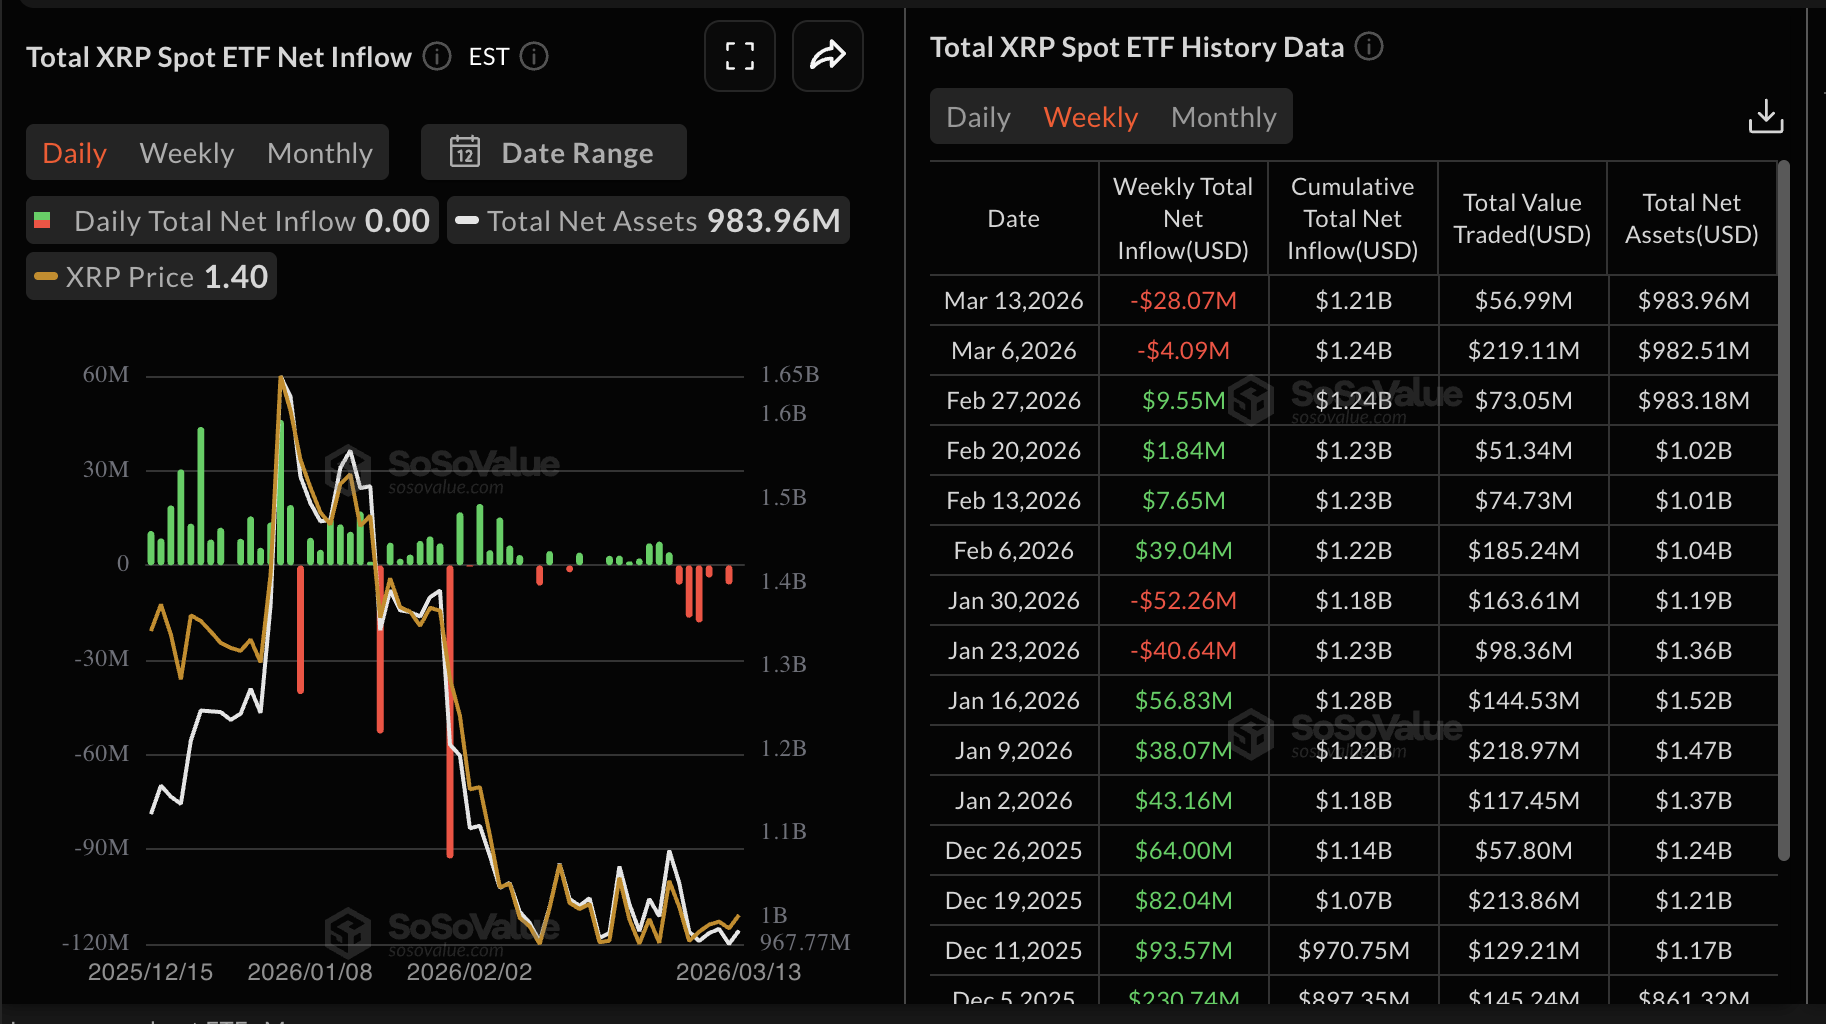
- XRP digital asset investment products recorded outflows of $76 million last week, with ETFs losing $28 million.
Ripple (XRP) is extending gains, trading above $1.47 at the time of writing on Monday. The remittance token appears to be tapping into positive market sentiment, as cryptocurrency prices have broadly risen, shrugging off the war in the Middle East.
Retail interest in XRP shows that risk appetite is gradually increasing. However, institutional investors are taking a step back, pulling resources from XRP digital asset investment products.
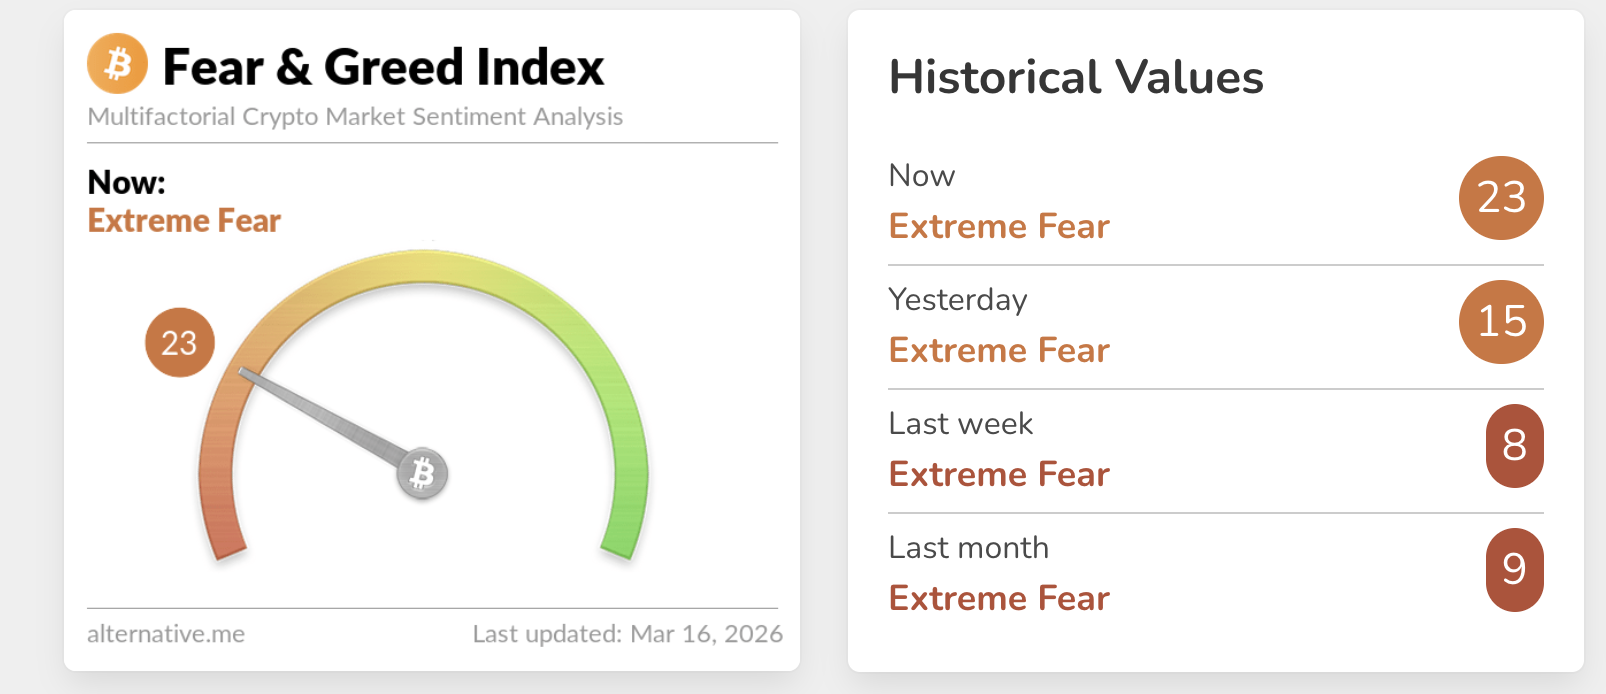
Sentiment has continued to improve despite the war in the Middle East, as shown by the Fear & Greed Index, which signals 23 on Monday, up from 15 the previous day and 8 last week.
Despite the increase, the index is still in extreme fear, which may limit XRP’s recovery potential if sentiment lags.
Renewed retail interest boosts XRP’s recovery potential
Retail traders appear to be making a steady comeback into the market, as seen in XRP futures Open Interest (OI) rising to $2.66 billion on Monday, from $$2.56 billion the previous day.
The OI narrowed to $2.11 billion on March 4, undermining retail interest, considering it peaked at $10.94 billion in July. For XRP to sustain the ongoing recovery, a robust derivatives market is required.
Meanwhile, institutional demand has taken a back seat, as XRP digital asset investment products experienced outflows of approximately $76 million last week, according to a CoinShares report. Month-to-date outflows total $133 million, bringing assets under management to $2.4 billion.
XRP spot Exchange-Traded Funds (ETFs) suffered their second week of outflows, totaling $28 million. The outflows increased from $4 million, recorded during the week ending March 6. Cumulative inflows currently stand at $1.21 billion, with net assets under management at $984 million.
Weak sentiment, as reflected in the Fear & Greed Index, and macroeconomic uncertainty amid the Middle East war are among the factors that continue to limit interest in XRP-related investment products.
Technical outlook: XRP gains momentum amid stronger technicals
XRP is trading above $1.47, with its near-term bias remaining mildly bullish. Momentum conditions have also improved, with the Relative Strength Index at 56, edging higher on the daily chart. A sustained rebound suggests that bulls have the upper hand. The Moving Average Convergence Divergence (MACD) indicator runs above its signal line on the same chart, suggesting only a modest recovery phase.
-1773671517241-1773671517244.png)
Initial resistance lies at the recent swing highs around $1.49–$1.50, where the 50-day Exponential Moving Average (EMA) converges with the SuperTrend indicator, forming a dynamic hurdle at $1.59. On the downside, immediate support lies at $1.40, with further downside levels near $1.35 and then the recent floor at $1.30, where previous lows cluster and where buyers last responded.
A daily close below $1.30 would reopen the broader bearish leg, while only a decisive break above $1.50 would start to erode the overall downside bias.
Cryptocurrency metrics FAQs
The developer or creator of each cryptocurrency decides on the total number of tokens that can be minted or issued. Only a certain number of these assets can be minted by mining, staking or other mechanisms. This is defined by the algorithm of the underlying blockchain technology. On the other hand, circulating supply can also be decreased via actions such as burning tokens, or mistakenly sending assets to addresses of other incompatible blockchains.
Market capitalization is the result of multiplying the circulating supply of a certain asset by the asset’s current market value.
Trading volume refers to the total number of tokens for a specific asset that has been transacted or exchanged between buyers and sellers within set trading hours, for example, 24 hours. It is used to gauge market sentiment, this metric combines all volumes on centralized exchanges and decentralized exchanges. Increasing trading volume often denotes the demand for a certain asset as more people are buying and selling the cryptocurrency.
Funding rates are a concept designed to encourage traders to take positions and ensure perpetual contract prices match spot markets. It defines a mechanism by exchanges to ensure that future prices and index prices periodic payments regularly converge. When the funding rate is positive, the price of the perpetual contract is higher than the mark price. This means traders who are bullish and have opened long positions pay traders who are in short positions. On the other hand, a negative funding rate means perpetual prices are below the mark price, and hence traders with short positions pay traders who have opened long positions.
(The technical analysis of this story was written with the help of an AI tool.)
Recommended Articles


