




Ripple Price Forecast: XRP tests recovery strength amid steady ETF inflows, growing retail interest
- XRP extends gains for the second consecutive day as crypto prices steady despite the Middle East war.
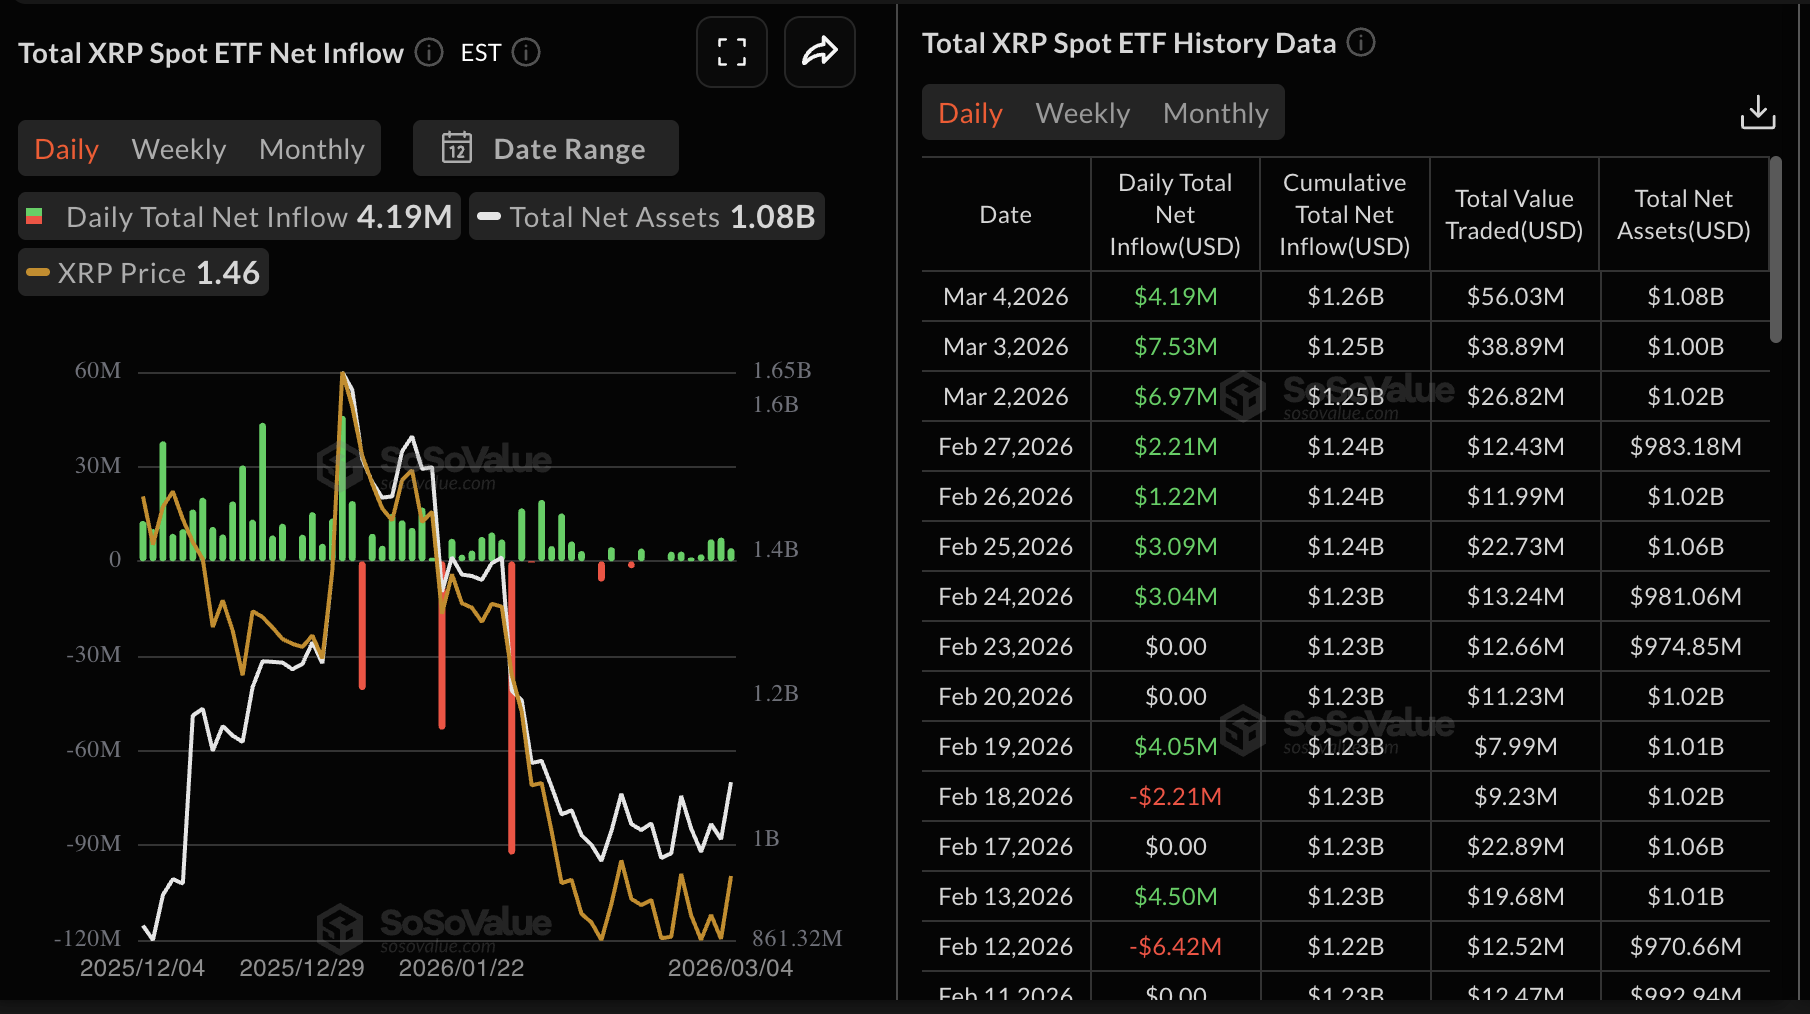
- Investors increase their exposure through ETFs, with cumulative inflows reaching $1.26 billion on Wednesday.
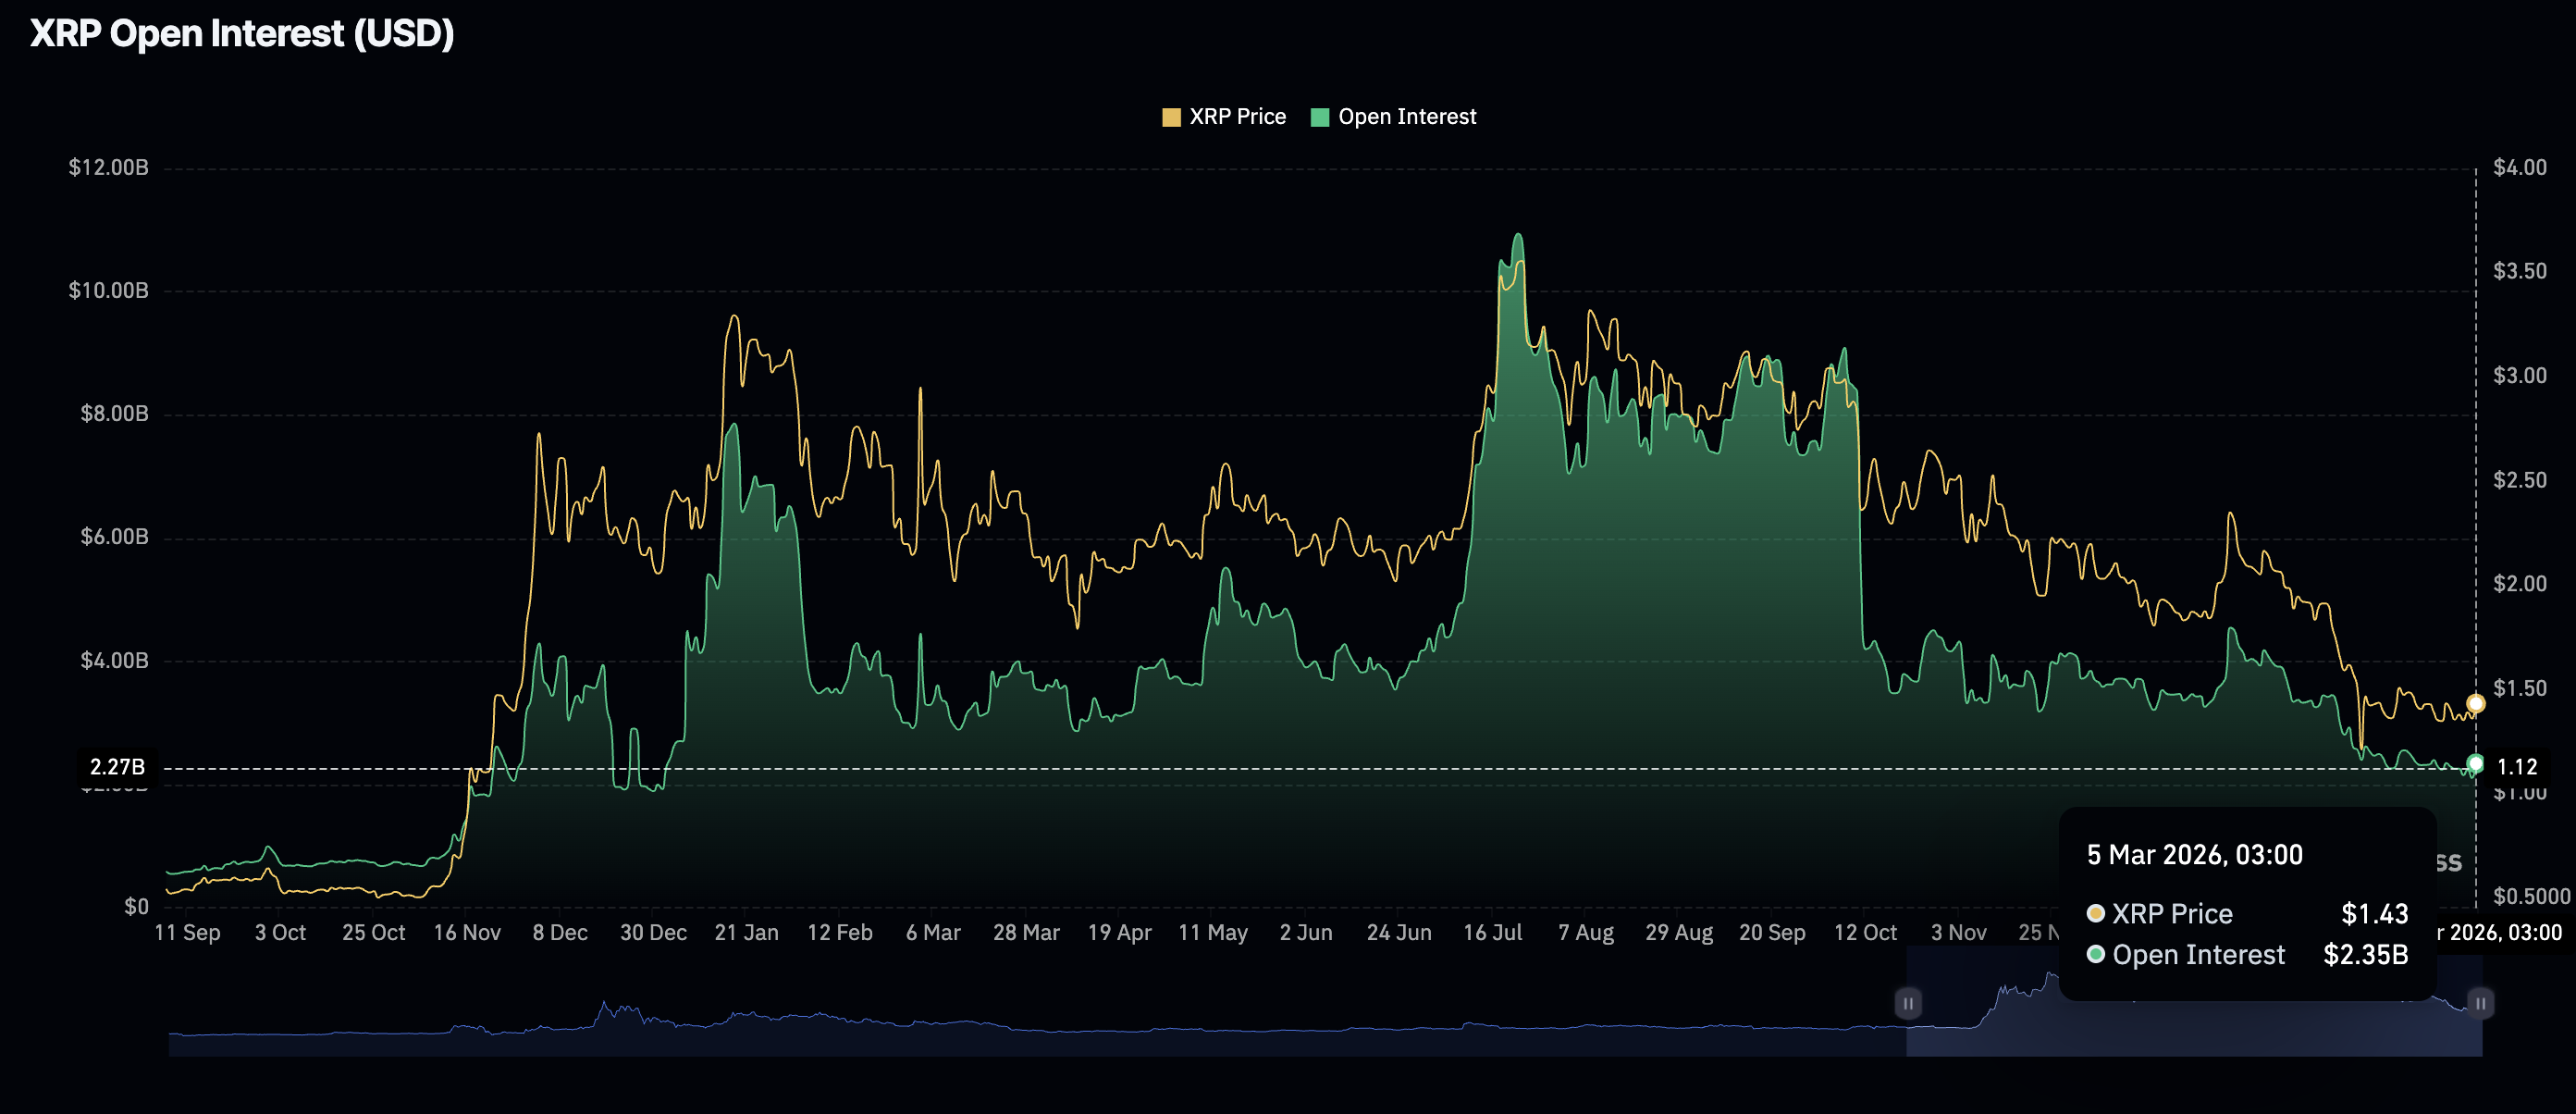
- Demand for XRP derivatives returns, with futures Open Interest increasing slightly to $2.35 billion on Thursday.
Ripple (XRP) continues to demonstrate notable resilience as the cryptocurrency market navigates the persistent war in the Middle East after the United States (US) and Israel attacked Iran on Saturday.
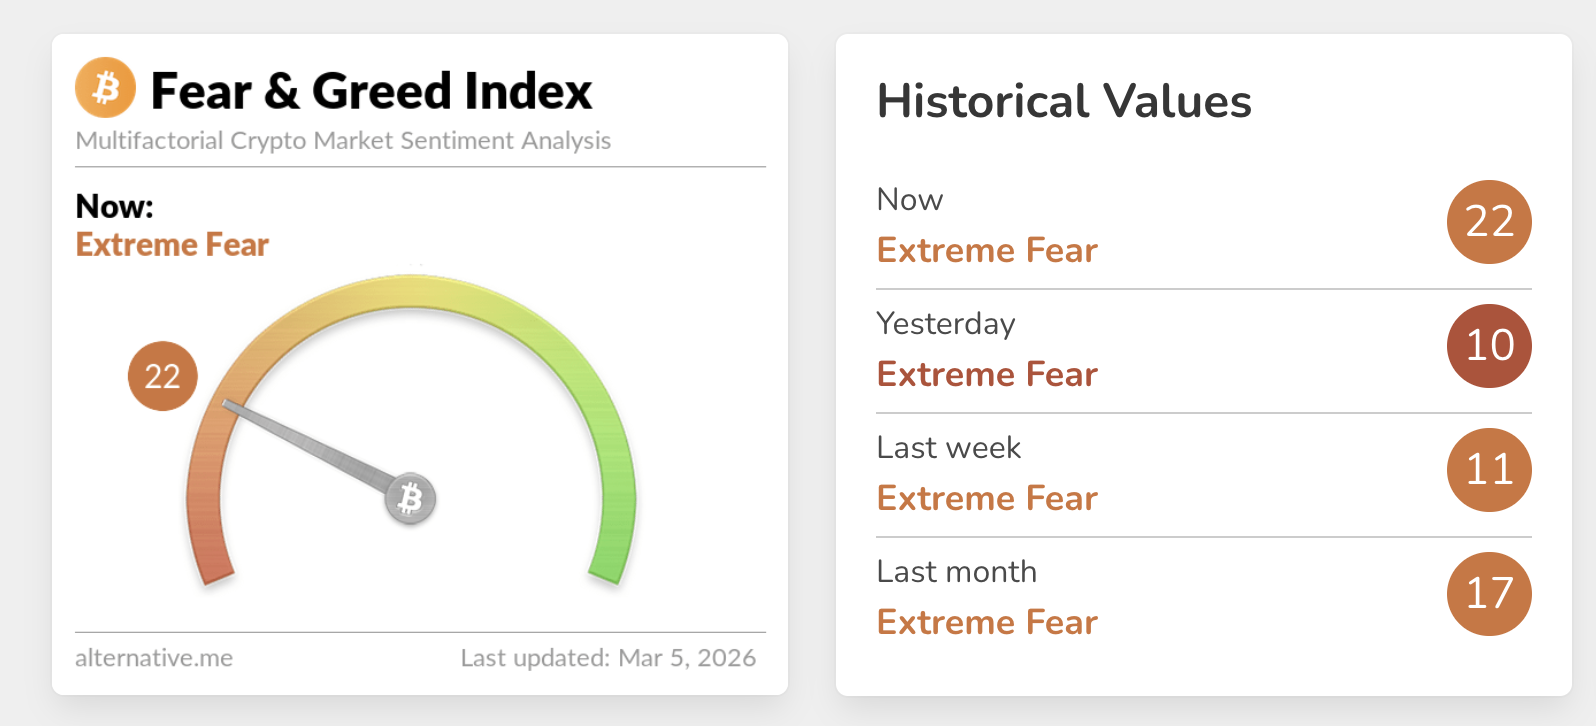
The remittance token is trading above $1.44 at the time of writing on Thursday, up from its daily open of $1.43. Meanwhile, sentiment in the broader crypto market is improving, with the Fear & Green Index rising to 22, from 10 on Wednesday.
Institutional and retail interest steadies XRP price
Investors seeking exposure to XRP through Exchange-Traded Funds (ETFs) continue to do so despite the war-driven uncertainty in the Middle East. Over the past seven days, US-listed spot XRP ETFs have attracted inflows, with approximately $4 million recorded on Wednesday. Canary Capital’s XRPC ETF accounted for all the inflows, as activity remained muted across the rest of the products. Cumulative inflows ticked up, reaching $1.26 billion on Wednesday, up from $1.25 billion the previous day. Total assets under management hold above $1 billion, according to SoSoValue data.
Retail investors have also shown signs of returning to the market, as reflected in futures Open Interest (OI), which has risen to $2.35 billion on Thursday from $2.11 billion the previous day. Although the OI holds significantly below the record $10.94 billion reached in July, the mild increase could help shape XRP’s short-term outlook if it holds.
Technical outlook: XRP shows early signs of strength
XRP hovers above $1.44 as its short-term outlook turns mildly bullish, supported by a gradually increasing Relative Strength Index (RSI) at 49 on the daily chart. The Moving Average Convergence Divergence (MACD) indicator remains above its signal line on the same chart, with green histogram bars expanding. If this short-term bullish case holds, XRP could drift higher toward the 50-day Exponential Moving Average (EMA) at $1.57.
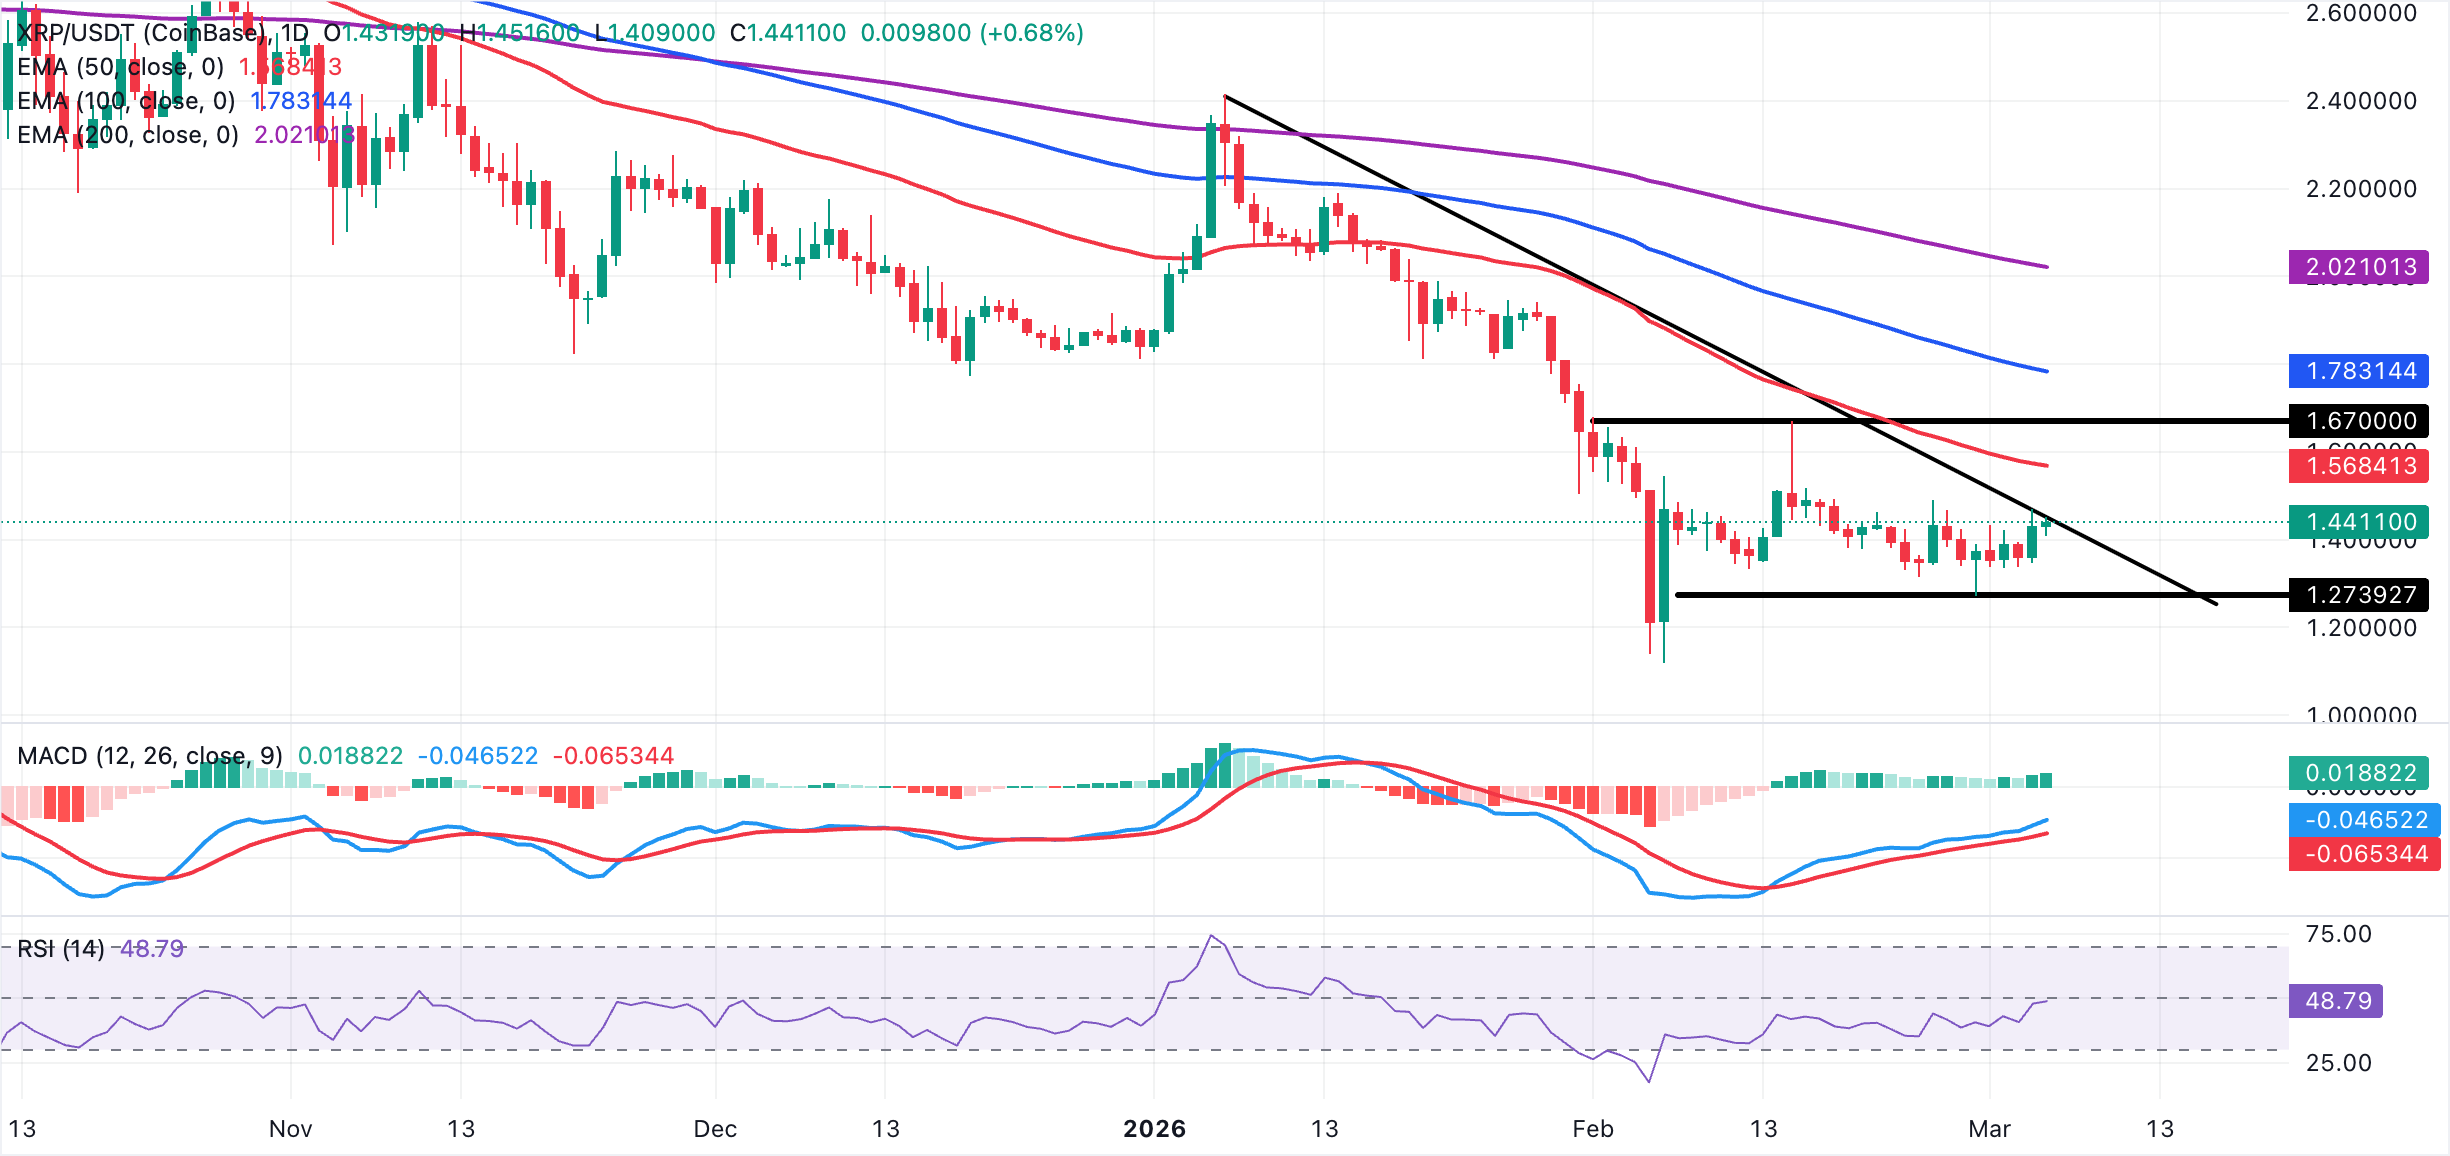
Meanwhile, a descending resistance trend line from $2.40 has repeatedly capped rebounds and still overhangs the price despite a test of the immediate resistance around $1.44. A daily close above this supply zone is needed to open the way to the 50-day EMA at $1.57 and, later, the 100-day EMA at $1.78. On the downside, immediate support lies at the daily low at $1.43. A loss of this level would expose the demand zone at $1.35, aligning with Wednesday's low.
Cryptocurrency metrics FAQs
The developer or creator of each cryptocurrency decides on the total number of tokens that can be minted or issued. Only a certain number of these assets can be minted by mining, staking or other mechanisms. This is defined by the algorithm of the underlying blockchain technology. On the other hand, circulating supply can also be decreased via actions such as burning tokens, or mistakenly sending assets to addresses of other incompatible blockchains.
Market capitalization is the result of multiplying the circulating supply of a certain asset by the asset’s current market value.
Trading volume refers to the total number of tokens for a specific asset that has been transacted or exchanged between buyers and sellers within set trading hours, for example, 24 hours. It is used to gauge market sentiment, this metric combines all volumes on centralized exchanges and decentralized exchanges. Increasing trading volume often denotes the demand for a certain asset as more people are buying and selling the cryptocurrency.
Funding rates are a concept designed to encourage traders to take positions and ensure perpetual contract prices match spot markets. It defines a mechanism by exchanges to ensure that future prices and index prices periodic payments regularly converge. When the funding rate is positive, the price of the perpetual contract is higher than the mark price. This means traders who are bullish and have opened long positions pay traders who are in short positions. On the other hand, a negative funding rate means perpetual prices are below the mark price, and hence traders with short positions pay traders who have opened long positions.
(The technical analysis of this story was written with the help of an AI tool.)
Recommended Articles


