




Crypto Today: Bitcoin, Ethereum, XRP hold weekly gains despite US-Iran war
- Bitcoin steadies above $73,000, but remains below the weekly high of $74,050 as the US-Iran rages on.
- Ethereum’s rebound gains momentum, testing the upper end of the range, with resistance around $2,200.
- XRP rises for the second consecutive day as broader market sentiment recovers.
The cryptocurrency market is gaining strength on Thursday, building on Wednesday's upswing, which saw Bitcoin reach a weekly high above $74,000. Ethereum (ETH) and Ripple (XRP) are moderating their recent gains amid uncertainty stemming from the escalating war in the Middle East.
US escalates strikes against Iran as risk assets stabilize
The US has reportedly sunk over 20 Iranian ships in international waters of the Indian Ocean while Israel is ramping up attacks on Tehran, Iran’s capital city. On the other hand, Iran is widening the scope of the war in the Middle East, launching strikes on key Gulf region facilities, including Oil plants and transport hubs.
Tensions remain high in global markets, with Brent Crude Oil prices holding above $80. Continued disruption of major shipping routes, such as the Strait of Hormuz, could push Oil prices higher, increasing the odds of higher inflation and significantly reducing the chances of rate cuts in 2026.
Despite the war escalating, crypto prices have not collapsed. Bitcoin is up over 15% from its low on Saturday at $63,030. ETH and XRP appear to be holding onto most of the gains accrued this week.
Although sentiment remains in extreme fear, it improved to 22 on Thursday, up from 10 the previous day. A steady increase in this metric indicates that investors are regaining confidence in crypto assets despite the war.
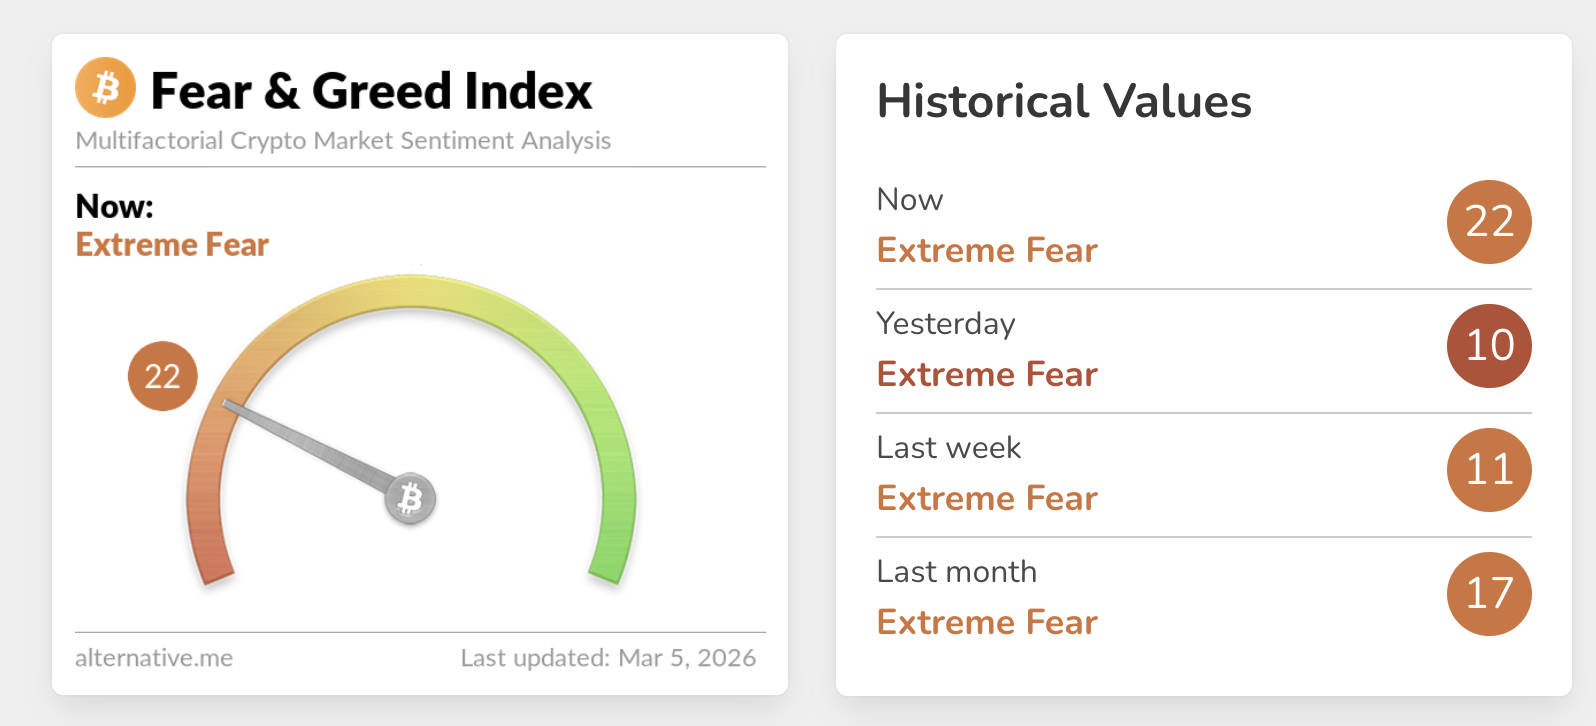
Chart of the day: Bitcoin eyes higher support
Bitcoin hovers above $73,000, with the near-term bias turning mildly bullish after breaking above the pivotal $70,000 level. The overall short-term momentum aligns with this improving tone as the Moving Average Convergence Divergence (MACD) remains above its signal line on the daily chart. Green histogram bars are expanding, likely prompting traders to increase their exposure.
Meanwhile, the Relative Strength Index (RSI) is near 57 on the same chart, pointing north, reflecting the current market conditions as Bitcoin seeks higher support and an extension of its rebound.
An extended increase in the RSI would confirm Bitcoin's short-term bullish case for a breakout beyond the 50-day Exponential Moving Average (EMA) at $74,400.
-1772709393723-1772709393726.png)
Bitcoin's immediate support emerges around the $70,000 pivotal level. A break of this demand zone would expose the next key level at $68,338, aligning with Wednesday's open. As long as Bitcoin holds above $68,338, the path of least resistance would favor bulls and steady price increases.
Altcoins technical outlook: Ethereum and XRP momentum stalls
Ethereum is holding near the upper end of the range, with resistance at $2,200. Although its near-term outlook remains mildly bullish, the leading altcoin trades below the 50-day, 100-day, and 200-day Exponential Moving Averages (EMAs) clustered between $2,290 and $2,927.
Meanwhile, the MACD indicator remains above its signal line on the daily chart, while green histogram bars expand, reinforcing the bullish grip. The RSI at 52 on the same chart shows momentum has shifted from neutral to slightly bullish, aligning with Ethereum's increase from Saturday's low at $1,835.
-1772706015945-1772706015946.png)
Initial support emerges near the daily low at $2,093, guarding the more important weekly open at $1,940. A break below $1,940 would expose the next demand zone at $1,835, which marked Saturday's low. On the upside, if buyers push above the immediate $2,200 resistance, Ethereum would be exposed to the 50-day EMA hurdle at $2,290 and, later, the 100-day EMA at $2,629.
As for XRP, its overall bias remains mildly bullish, with support at $1.41 intact. Despite the steady increase from Saturday's low at $1.27, the 50-day, 100-day, and 200-day EMAs clustered between $1.57 and $2.02 appear to cap rebounds.
The RSI at 49 is right below neutral on the daily chart, suggesting that bearish momentum is easing. If the RSI extends above the 50 midline, the path of least resistance could stay upward and increase the odds of a breakout beyond the 50-day EMA hurdle at $1.57.
The MACD indicator holds above the signal line with green histogram bars gradually expanding on the same chart, also signaling a potential bullish shift.
-1772706971579-1772706971581.png)
Initial resistance emerges near $1.47, aligning with Thursday's high. The 50-day EMA at $1.57 is a stronger barrier that could constrain the XRP price. On the downside, immediate support sits around $1.41, the daily low, with a break exposing the next bearish target near $1.35.
Cryptocurrency prices FAQs
Token launches influence demand and adoption among market participants. Listings on crypto exchanges deepen the liquidity for an asset and add new participants to an asset’s network. This is typically bullish for a digital asset.
A hack is an event in which an attacker captures a large volume of the asset from a DeFi bridge or hot wallet of an exchange or any other crypto platform via exploits, bugs or other methods. The exploiter then transfers these tokens out of the exchange platforms to ultimately sell or swap the assets for other cryptocurrencies or stablecoins. Such events often involve an en masse panic triggering a sell-off in the affected assets.
Macroeconomic events like the US Federal Reserve’s decision on interest rates influence crypto assets mainly through the direct impact they have on the US Dollar. An increase in interest rate typically negatively influences Bitcoin and altcoin prices, and vice versa. If the US Dollar index declines, risk assets and associated leverage for trading gets cheaper, in turn driving crypto prices higher.
Halvings are typically considered bullish events as they slash the block reward in half for miners, constricting the supply of the asset. At consistent demand if the supply reduces, the asset’s price climbs.
(The technical analysis of this story was written with the help of an AI tool.)
Recommended Articles


