



Ethereum Gathers Strength — Upside Breakout Could Confirm Recovery Phase

Source Newsbtc

Ethereum price started a recovery wave from $3,700. ETH is moving higher but faces a couple of key hurdles near $3,900 and $3,955.

  • Ethereum started a fresh recovery above $3,780 and $3,820.
  • The price is trading above $3,850 and the 100-hourly Simple Moving Average.
  • There is a bearish trend line forming with resistance at $3,900 on the hourly chart of ETH/USD (data feed via Kraken).
  • The pair could continue to move up if it trades above $3,920.

Ethereum Price Eyes Upside Break

Ethereum price started a minor recovery wave from the $3,710 zone, like Bitcoin. ETH price surpassed the $3,800 and $3,820 levels to enter a short-term positive zone.

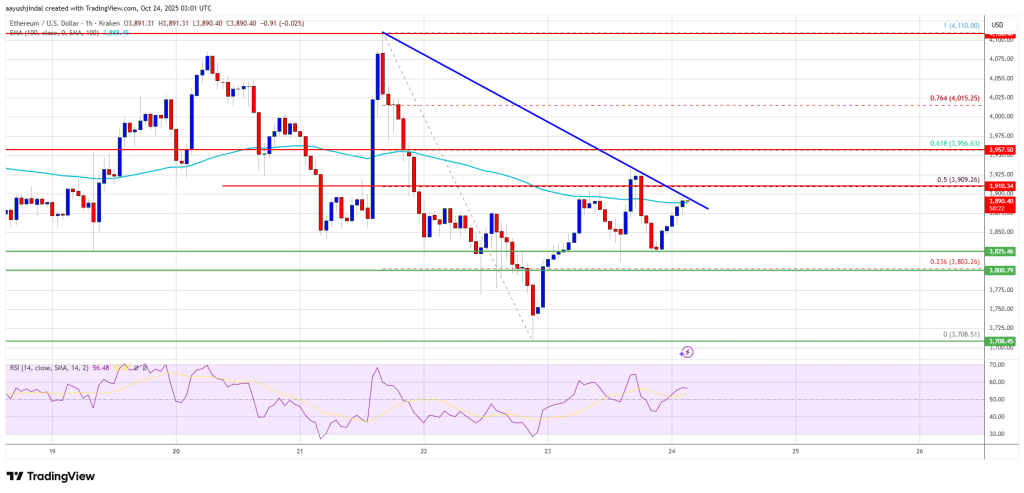
The price even spiked above $3,880, but the bears were active near the 50% Fib retracement level of the downward move from the $4,110 swing high to the $3,708 low. Besides, there is a bearish trend line forming with resistance at $3,900 on the hourly chart of ETH/USD.

Ethereum price is now trading above $3,850 and the 100-hourly Simple Moving Average. On the upside, the price could face resistance near the $3,880 level and the trend line.
Ethereum Price

The next key resistance is near the $3,955 level or the 61.8% Fib retracement level of the downward move from the $4,110 swing high to the $3,708 low. The first major resistance is near the $4,020 level. A clear move above the $4,020 resistance might send the price toward the $4,120 resistance. An upside break above the $4,120 region might call for more gains in the coming sessions. In the stated case, Ether could rise toward the $4,150 resistance zone or even $4,165 in the near term.

Another Decline In ETH?

If Ethereum fails to clear the $3,900 resistance, it could start a fresh decline. Initial support on the downside is near the $3,820 level. The first major support sits near the $3,800 zone.

A clear move below the $3,800 support might push the price toward the $3,720 support. Any more losses might send the price toward the $3,650 region in the near term. The next key support sits at $3,620.

Technical Indicators

Hourly MACD – The MACD for ETH/USD is losing momentum in the bullish zone.

Hourly RSI – The RSI for ETH/USD is now above the 50 zone.

Major Support Level – $3,800

Major Resistance Level – $3,900

Disclaimer: For information purposes only. Past performance is not indicative of future results.
placeholder
Traders Place Record Bets Against Oil: Could Prices Fall to $70?Traders placed record bets against oil on Tuesday. Volume in Brent put options topped 764,000 contracts, according to preliminary ICE Futures Europe data cited by Bloomberg.A put option pays off when
Author  Beincrypto
Sept 24, Thu
Traders placed record bets against oil on Tuesday. Volume in Brent put options topped 764,000 contracts, according to preliminary ICE Futures Europe data cited by Bloomberg.A put option pays off when
placeholder
Bitcoin Falls Below $84,000 as Hot US Data Sends Yields HigherBitcoin (BTC) fell below $84,000 on Wednesday after a surprise jump in US business activity sent Treasury yields higher.The drop came within about an hour of the data release. It reversed a morning ra
Author  Beincrypto
Sept 24, Thu
Bitcoin (BTC) fell below $84,000 on Wednesday after a surprise jump in US business activity sent Treasury yields higher.The drop came within about an hour of the data release. It reversed a morning ra
placeholder
Paramount Courts Elon Musk for Investment as Stock Nears Multi-Year LowsParamount Skydance has discussed bringing Elon Musk in as an equity investor, Semafor reported on Wednesday. Its stock, meanwhile, trades near its lowest levels in years.CEO David Ellison wants wealth
Author  Beincrypto
Sept 24, Thu
Paramount Skydance has discussed bringing Elon Musk in as an equity investor, Semafor reported on Wednesday. Its stock, meanwhile, trades near its lowest levels in years.CEO David Ellison wants wealth
placeholder
Treasury's 5-Year Auction Hits 20-Year Yield High: What This Means for BitcoinThe US Treasury paid its highest yield on a 5-year note since June 2006, a sign that demand for government debt is weakening even as yields stay elevated across the board.Rising yields raise borrowing
Author  Beincrypto
Sept 24, Thu
The US Treasury paid its highest yield on a 5-year note since June 2006, a sign that demand for government debt is weakening even as yields stay elevated across the board.Rising yields raise borrowing
placeholder
Palantir Stock Hits Yearly High at $190. What’s Driving the Price?Palantir Technologies shares climbed above $190 on September 23, 2026. That marked its highest level in nearly a year, extending a rally built on three separate catalysts.The stock advanced more than
Author  Beincrypto
Sept 24, Thu
Palantir Technologies shares climbed above $190 on September 23, 2026. That marked its highest level in nearly a year, extending a rally built on three separate catalysts.The stock advanced more than
goTop
quote