


Silver Price Forecast: XAG/USD dips below $38.30 as the Dollar picks up
Silver fails to break above $38.75 highs and retreats below $38.20.
The US Dollar's upside attempts remain limited amid hopes of immediate Fed cuts.
XAG/USD is showing a bearish divergence that hints to a deeper reversal
Silver (XAG/USD) accelerates its reversal from the 38.75 highs, reaching session lows below 38.30 and turning negative on daily charts. The US Dollar Index has extended its recovery, although it remains unable to put a significant distance from the two-week lows hit earlier this week.
Recent US data and investors’ hopes that the Fed will cut rates in September are acting as headwinds for any US recovery attempt. These views were endorsed further by US Treasury Secretary Scott Bessent, who hinted at a 50 bps cut next month, following the moderate US inflation data released on Tuesday.
Today the market is looking to the US Weekly Jobless Claims, which are expected to confirm the softening momentum of the US labour market, with a 2,000 increase to 228,000 new claims. These figures will be contrasted with July’s US PPI reading, which is expected to show hotter inflationary pressures.
Technical Analysis: XAG/USD shows a bearish divergence
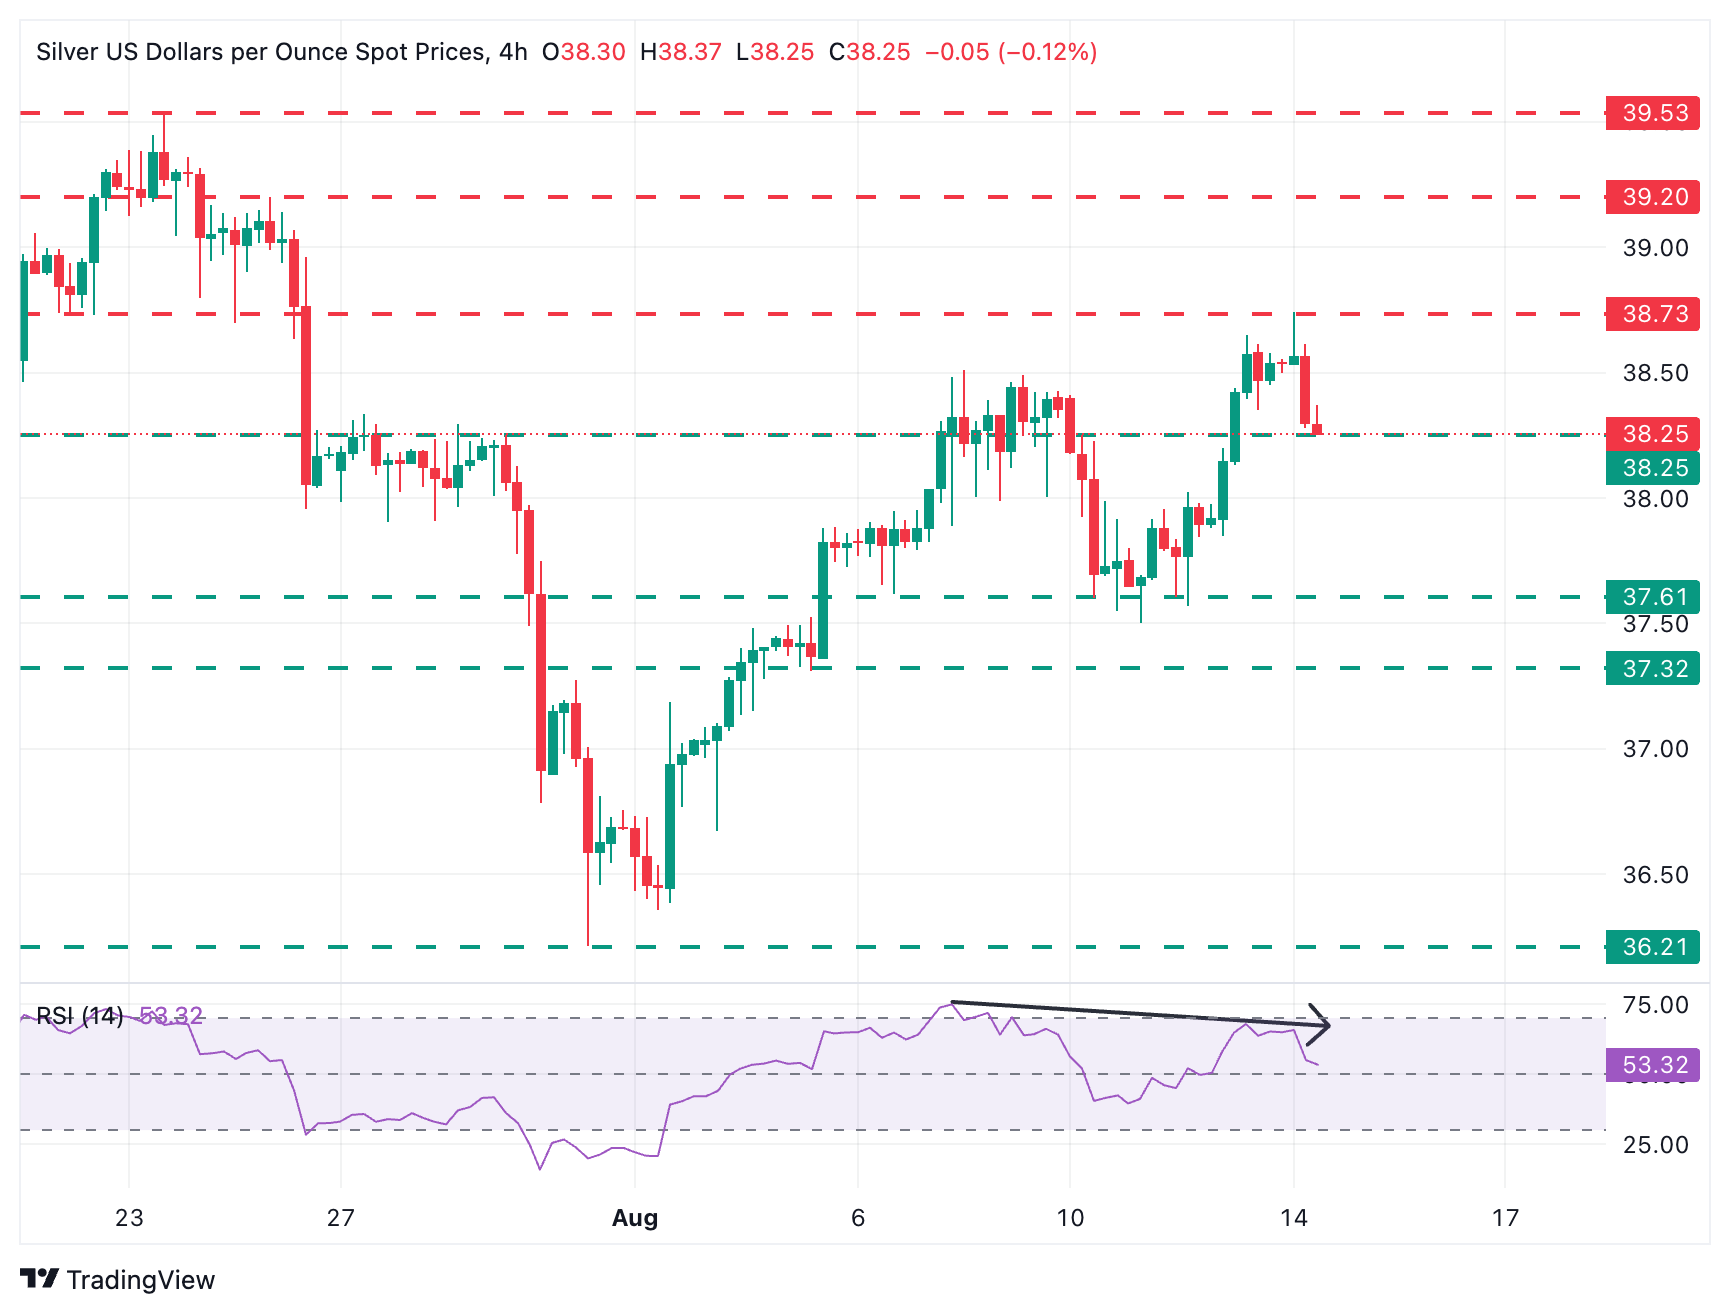
From a technical perspective, the impulsive reversal from the $38.75 suggests mounting bearish pressure. Technical indicators remain positive, but the bearish divergence observed in the 4-hour RSI points to a deeper correction.
The pair is clinging to a previous resistance area at the $38.30 area. Below here, the next targets are the August 12 low, at $37,60, and the August 5 low, at $37.30.To the upside, immediate resistance is at the mentioned intra-day high, at $38.75 ahead of the $39.20 intra-day level and the July 23 high, at 39.55.
Silver FAQs
Silver is a precious metal highly traded among investors. It has been historically used as a store of value and a medium of exchange. Although less popular than Gold, traders may turn to Silver to diversify their investment portfolio, for its intrinsic value or as a potential hedge during high-inflation periods. Investors can buy physical Silver, in coins or in bars, or trade it through vehicles such as Exchange Traded Funds, which track its price on international markets.
Silver prices can move due to a wide range of factors. Geopolitical instability or fears of a deep recession can make Silver price escalate due to its safe-haven status, although to a lesser extent than Gold's. As a yieldless asset, Silver tends to rise with lower interest rates. Its moves also depend on how the US Dollar (USD) behaves as the asset is priced in dollars (XAG/USD). A strong Dollar tends to keep the price of Silver at bay, whereas a weaker Dollar is likely to propel prices up. Other factors such as investment demand, mining supply – Silver is much more abundant than Gold – and recycling rates can also affect prices.
Silver is widely used in industry, particularly in sectors such as electronics or solar energy, as it has one of the highest electric conductivity of all metals – more than Copper and Gold. A surge in demand can increase prices, while a decline tends to lower them. Dynamics in the US, Chinese and Indian economies can also contribute to price swings: for the US and particularly China, their big industrial sectors use Silver in various processes; in India, consumers’ demand for the precious metal for jewellery also plays a key role in setting prices.
Silver prices tend to follow Gold's moves. When Gold prices rise, Silver typically follows suit, as their status as safe-haven assets is similar. The Gold/Silver ratio, which shows the number of ounces of Silver needed to equal the value of one ounce of Gold, may help to determine the relative valuation between both metals. Some investors may consider a high ratio as an indicator that Silver is undervalued, or Gold is overvalued. On the contrary, a low ratio might suggest that Gold is undervalued relative to Silver.
Recommended Articles


