


AUD/JPY Forecast 2026: What to Expect for the Aussie Yen
AUD/JPY hit levels not seen since 1990 in early March 2026.

Image via TradingView: AUD/JPY Monthly Chart
That alone tells you something unusual is happening. This AUD/JPY forecast 2026 guide breaks down exactly what's driving it.
Here's the short version. The RBA has hiked rates twice this year. The yen has failed to rally despite a live Middle East conflict. And the carry trade is under pressure but hasn't broken.
We'll cover all of it. The macro drivers on both sides of the pair, how the carry trade holds up right now, and the key technical levels to watch.
We’ll also look at three scenarios for the rest of 2026 and how to trade AUD/JPY on Mitrade.
Where AUD/JPY Stands Right Now
Let's start with the price action, because it tells the story better than anything else.
As we saw, AUD/JPY climbed to its highest level since 1990 in early March 2026.
Rabobank Senior FX Strategist Jane Foley pointed to two forces behind that move: Australia's position as a net energy exporter and growing expectations that the RBA would hike rates again.
Both of those things happened. And the pair responded accordingly, pushing all the way to 113.95.
Then came the pullback.
Middle East tensions escalated sharply in the second half of March. Risk appetite dried up across global markets. And AUD/JPY dropped over 1.3% in a single week as traders moved out of carry positions and into safer assets.
That kind of move is fast for this pair.
As of early April 2026, AUD/JPY is trading in the 110 to 112 range, having pulled back from those March highs.

Image via TradingView: AUD/JPY Daily Chart
The 52-week range runs from 86.04 to 114.04, which puts the current price near the top end of that band.
Here's what the technicals show. The pair is still trading above its 50-day EMA, but the daily RSI has moved into oversold territory.
However, the uptrend from the August 2025 low of 94.40 remains intact. The pair needs to hold 110 to keep that structure in place.

Image via TradingView: AUD/JPY Daily Chart
The RBA Factor: Australia's Most Aggressive Rate Cycle in Over a Decade
The RBA has raised rates twice in 2026, bringing the cash rate to 4.10%, its highest level since 2012. That alone would be enough to support the Australian dollar. But there's more to it than that.
Markets are now pricing in another hike in May. If that lands, rates could reach 4.61% by year-end, according to current market pricing. That puts the RBA among the most hawkish central banks in the G10 right now.
Here's what makes the RBA story even more interesting. Australia is a net energy exporter. That means rising oil prices, driven by the Middle East conflict, are actually adding to Australia's export revenues rather than draining them.
Most developed economies are hurting from high oil prices. But Australia is quietly benefiting.
RBA Governor Michele Bullock has made the bank's thinking clear. Energy-driven inflation from the conflict could force the RBA to keep tightening.
Add that to an already hawkish posture, and the yield gap between Australia and Japan starts to look very wide indeed.
At 4.10% versus the BOJ's 0.75%, that spread sits at around 335 basis points. For carry traders, that differential is the whole game.
For context, a carry trade involves borrowing in a low-yield currency and investing in a higher-yield one to pocket the difference.
“Trade AUDJPY with an ASIC-regulated broker. Fast AUD funding via PayID. ”
The BOJ Factor: Gradual, Cautious, and Still Very Loose
Here's the contradiction at the heart of this trade. The Bank of Japan is the most hawkish it has been in 30 years. And yet the yen is still losing ground.
The BOJheld its policy rate at 0.75% at its March 2026 meeting. That's the highest level since 1995. The decision passed 8-1, with one board member pushing for an immediate hike to 1%.
The BOJ has signaled more hikes are coming. But the pace is slow and the conditions are cautious.
Why does that matter? Because even at 0.75%, real interest rates in Japan remain deeply negative.
Inflation is running above the BOJ's 2% target. That means the yen still offers very little real yield. And for carry traders, that's all that counts.
ING expects the next BOJ hike to come in October 2026. Oxford Economics puts the terminal rate at around 1%. State Street sees it reaching 1.25% to 1.50% if yen weakness persists.
But that's still far below the RBA's current rate. The gap remains wide.
Now here's the twist. The Middle East conflict would normally send traders rushing into the yen as a safe haven. But that's not happening this time.
Japan imports over 90% of its energy. With oil trading near $100 to $110 a barrel, high energy costs are raising stagflation concerns in Japan.
The same crisis hurting global markets is hurting Japan's economy directly.
That's why the yen's safe haven status has quietly eroded in 2026. The conflict that should be supporting it is actually working against it.
Three Things That Will Drive AUD/JPY for the Rest of 2026
These are the likely three drivers that will actually move the Aussie yen in 2026:
1. The RBA-BOJ Rate Gap
Every basis point of divergence matters for AUD/JPY. If the RBA hikes again in May and the BOJ holds through mid-year, the gap widens further. That's structurally bullish for the pair.
But watch the other direction too. If the BOJ accelerates its tightening timeline because the yen keeps weakening, the gap narrows from both ends at once.
BOJ Governor Ueda has left that option on the table. That's the scenario that would hurt carry traders most.
2. Oil Prices and the Middle East
This is the dynamic that caught most analysts off-guard in 2026. Oil above $100 helps Australia and hurts Japan.
Australia earns more from energy exports, while Japan pays more to import energy. This means the yen weakens and the AUD/JPY rises.
But if the conflict de-escalates and oil sustains a drop back below $90, that whole dynamic reverses. The yen's safe haven status reasserts itself. And a pair that climbed on energy asymmetry could fall just as fast.
3. China's Economic Health
Australia sends the bulk of its iron ore, coal, and LNG to China. When Chinese demand is strong, Australian export revenues rise and the AUD follows.
Goldman Sachs revised its 2026 GDP growth forecast for China higher following a US-China tariff agreement that reduced the threatened 100% tariff rate.
That's a tailwind for AUD right now. But any deterioration in Chinese PMI data would hit the Australian dollar hard and pull AUD/JPY lower with it.
“Trade AUDJPY with an ASIC-regulated broker. Fast AUD funding via PayID. ”
AUD/JPY Technical Levels to Watch
AUD/JPY is trading around 112.60 as of April 9, 2026.
The level to watch right now is 110.00. It's a psychological round number; it aligns with the 50-day EMA, and it also coincides with the 1991 and 2024 swing highs. That's a strong confluence of support.
If the pair holds here, a bounce back toward 113.95 will likely be in play. However, if it breaks, the next floor sits around 108.80.
On the upside, 113.95 is the line in the sand. That's where the March rally topped out. A weekly close above that level would open the path toward 115 to 117, where the next significant resistance zone sits.

Image via TradingView: AUD/JPY Daily Chart
Three Scenarios for AUD/JPY in 2026
No one can tell you exactly where AUD/JPY will be in six months. But you can prepare for what's most likely. Here are the three scenarios traders are watching right now.
Scenario 1: Bullish
Middle East tensions ease. Oil pulls back below $90. Risk appetite returns to global markets. The RBA hikes again in May, and the BOJ holds through mid-year. The carry trade regains its footing.
In this scenario, AUD/JPY breaks above 113.95 and targets the 115 to 117 zone by Q3 2026. This is the scenario where the current pullback looks like a buying opportunity in hindsight.
Scenario 2: Bearish
The conflict escalates further. Oil pushes above $110 and stays there. Risk-off sentiment dominates. The BOJ accelerates its tightening timeline as yen weakness fuels domestic inflation. The carry trade unwinds sharply.
AUD/JPY breaks below 110, loses the key support zone, and retests the 107 to 108 area. This is the scenario that punishes traders who are long and overleveraged.
Scenario 3: Range
The geopolitical situation stays uncertain but contained. Oil oscillates between $95 and $105. The RBA pauses after a May hike. The BOJ holds steady through mid-year. AUD/JPY consolidates between 109 and 113 for an extended period.
This is actually the most likely scenario in the near term. And it's tradeable too. Range traders can capture swings on each move between support and resistance.
All three scenarios are tradeable on Mitrade via CFDs. You can go long in Scenario 1, short in Scenario 2, or trade both directions in Scenario 3.
“Trade AUDJPY with an ASIC-regulated broker. Fast AUD funding via PayID. ”
How to Trade AUD/JPY on Mitrade
If any of those three scenarios resonate with you, here's how to act on them.
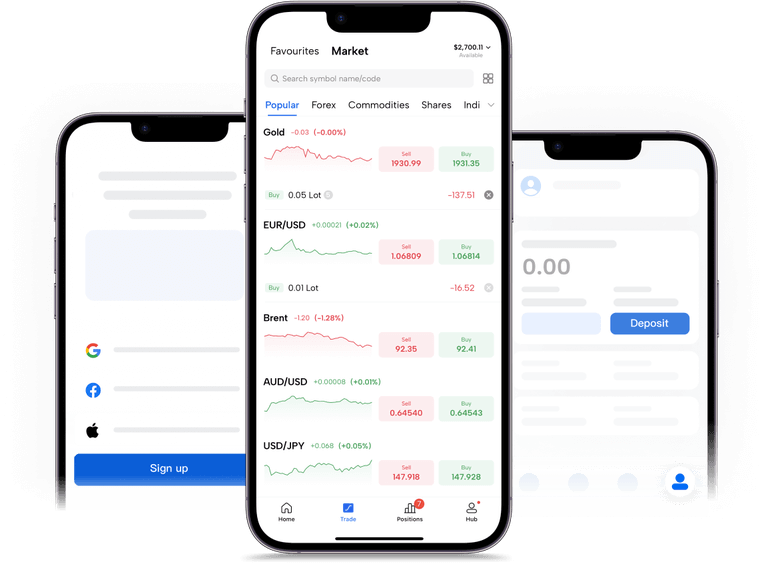
Mitrade is an ASIC-regulated CFD platform that lets you trade AUD/JPY directly.
You go long if you think the Australian dollar will strengthen against the yen. You go short if you think it will fall. You can trade both directions from the same account.
One thing that makes Mitrade particularly useful for this pair is the trading hours.
Forex runs 24 hours a day, five days a week. That means you can trade around the RBA and BOJ policy announcements, which are typically the biggest price-moving events for AUD/JPY.
If you're new to trading this pair, a free demo account lets you practice with virtual funds before putting real capital at risk.


1. What is the AUD/JPY forecast 2026?
The AUD/JPY forecast for 2026 points to a range of 109 to 117, depending on how the Middle East conflict evolves and what the RBA and BOJ do next. The bullish case targets 115 to 117 by Q3. The bearish case puts 107 to 108 back in play.
2. Why is AUD/JPY at multi-decade highs?
Two things drove it there. The RBA hiked rates twice in 2026, giving the Australian dollar a yield advantage. And Japan's heavy reliance on imported energy means the Middle East conflict is hurting the yen rather than supporting it as a safe haven.
3. How does the carry trade work with AUD/JPY?
You borrow in yen at a low interest rate and invest in Australian dollar assets at a higher rate. The difference, currently around 335 basis points, is your carry. It works best when markets are calm and volatility is low.
4. What happens to AUD to JPY if the BOJ raises rates?
A BOJ hike narrows the yield differential between Australia and Japan. That reduces the carry trade appeal of AUD/JPY and puts downward pressure on the pair. The faster the BOJ moves, the sharper the potential reversal.
5. Can I trade AUD/JPY as a CFD on Mitrade?
Yes. Mitrade offers AUD/JPY as a CFD instrument. You can go long or short, trade around central bank announcements, and start with a free demo account before committing real capital.
* The content presented above, whether from a third party or not, is considered as general advice only. This article should not be construed as containing investment advice, investment recommendations, an offer of or solicitation for any transactions in financial instruments.


