


Gold’s 18% Rally Faces a Volume Crisis, a Strong Rival, and a Wall of Puts

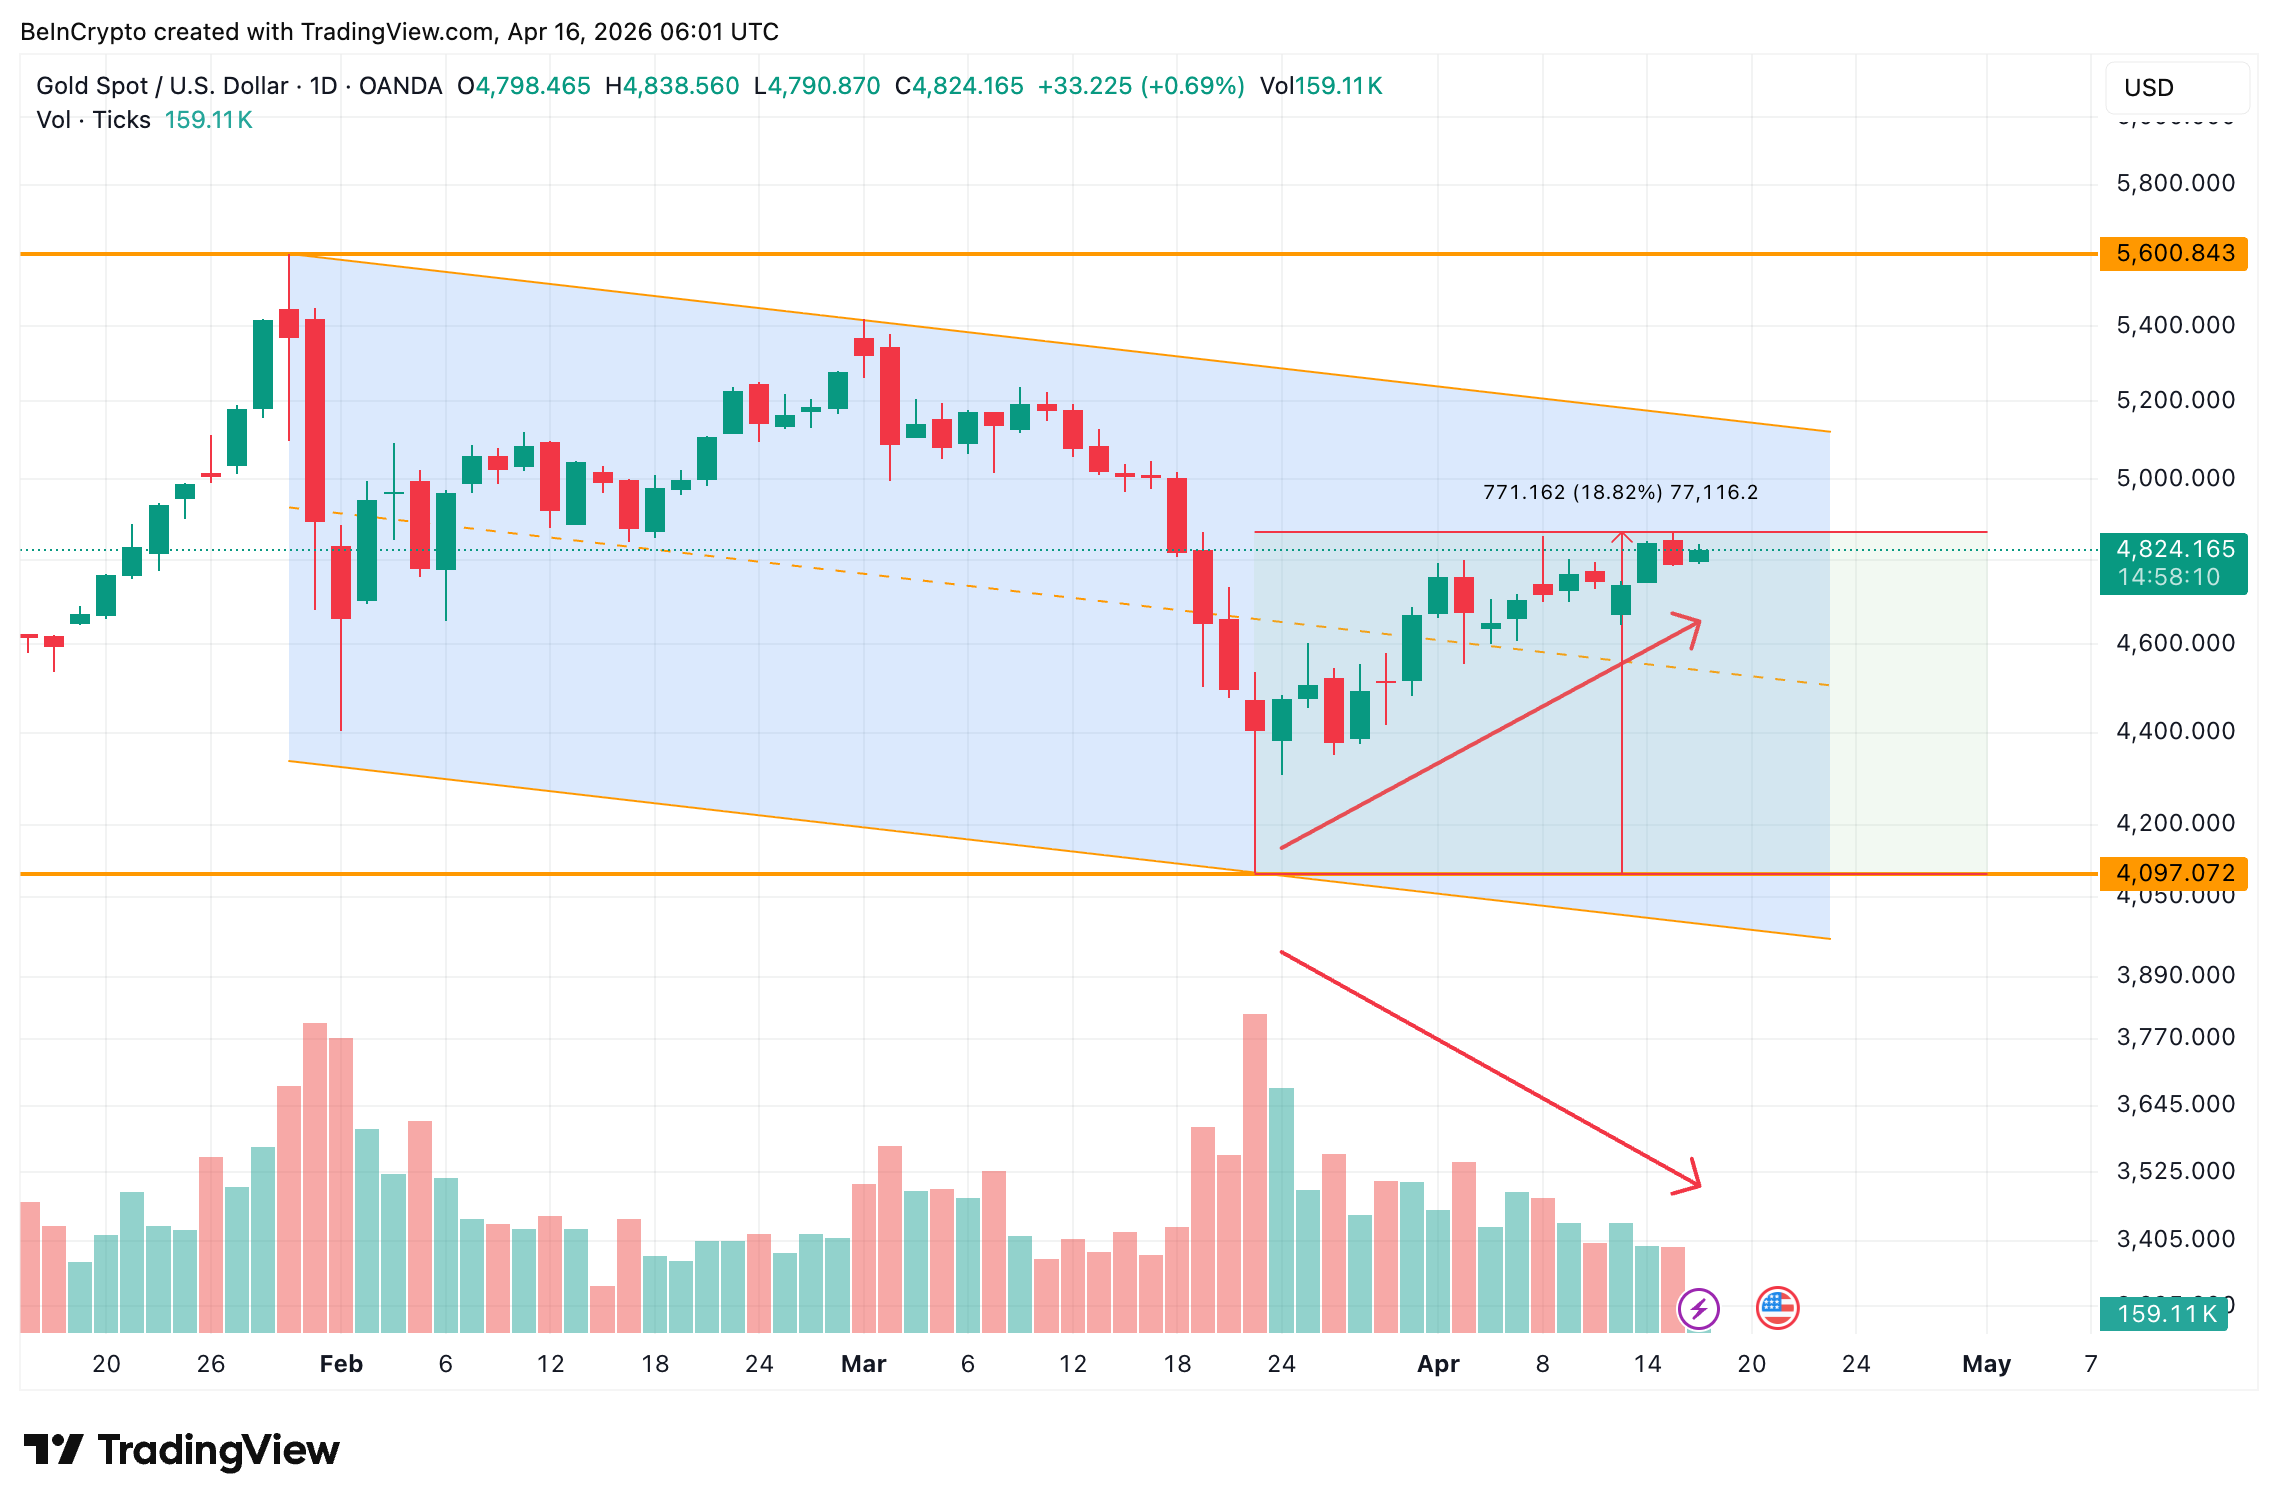
Gold (XAU/USD) price trades at $4,824, up 18% from its March 23 low of $4,097. The metal is pushing toward the upper trendline of a falling channel that has held since January 29.
Yet the rally has three problems beneath the surface. Volume is shrinking into resistance. The gold-silver ratio is breaking down. And options traders on the largest gold ETF are building bearish bets into the price rise.
Gold Rallies 18% on Declining Volume as Silver Takes the Lead
Gold price has traded inside a falling channel on the daily chart since peaking near $5,600 on January 29. The channel’s low was tested on March 23, when gold touched $4,097.
Since then, prices have climbed 18% toward the upper trendline. However, the volume profile tells a different story. Between March 24 and April 16, most successive rally candles have printed on progressively smaller volume. The most recent session recorded just 159.11K contracts, at press time. If real money were driving this move, volume would expand into resistance, not contract.
Want more insights like this? Sign up for Editor Harsh Notariya’s Daily Newsletter here.
Meanwhile, the gold-silver ratio confirms the weakness. This ratio measures how many ounces of silver it takes to buy one ounce of gold. It currently sits at 59.95. It is forming an inverted cup pattern on the daily chart. The ratio has dropped below the 0.618 Fibonacci level at 60.58.
A falling ratio means silver is outperforming gold. That typically happens when risk appetite improves and safe-haven demand fades. For the ratio to signal renewed gold strength, it would need to reclaim 60.58. Below that, 58.43 and 55.69 remain the downside targets. However, even a bounce now could only form the handle of this pattern, keeping the risk alive. Reclaiming 65.47 would therefore be more important if Gold were to defeat its immediate rival.
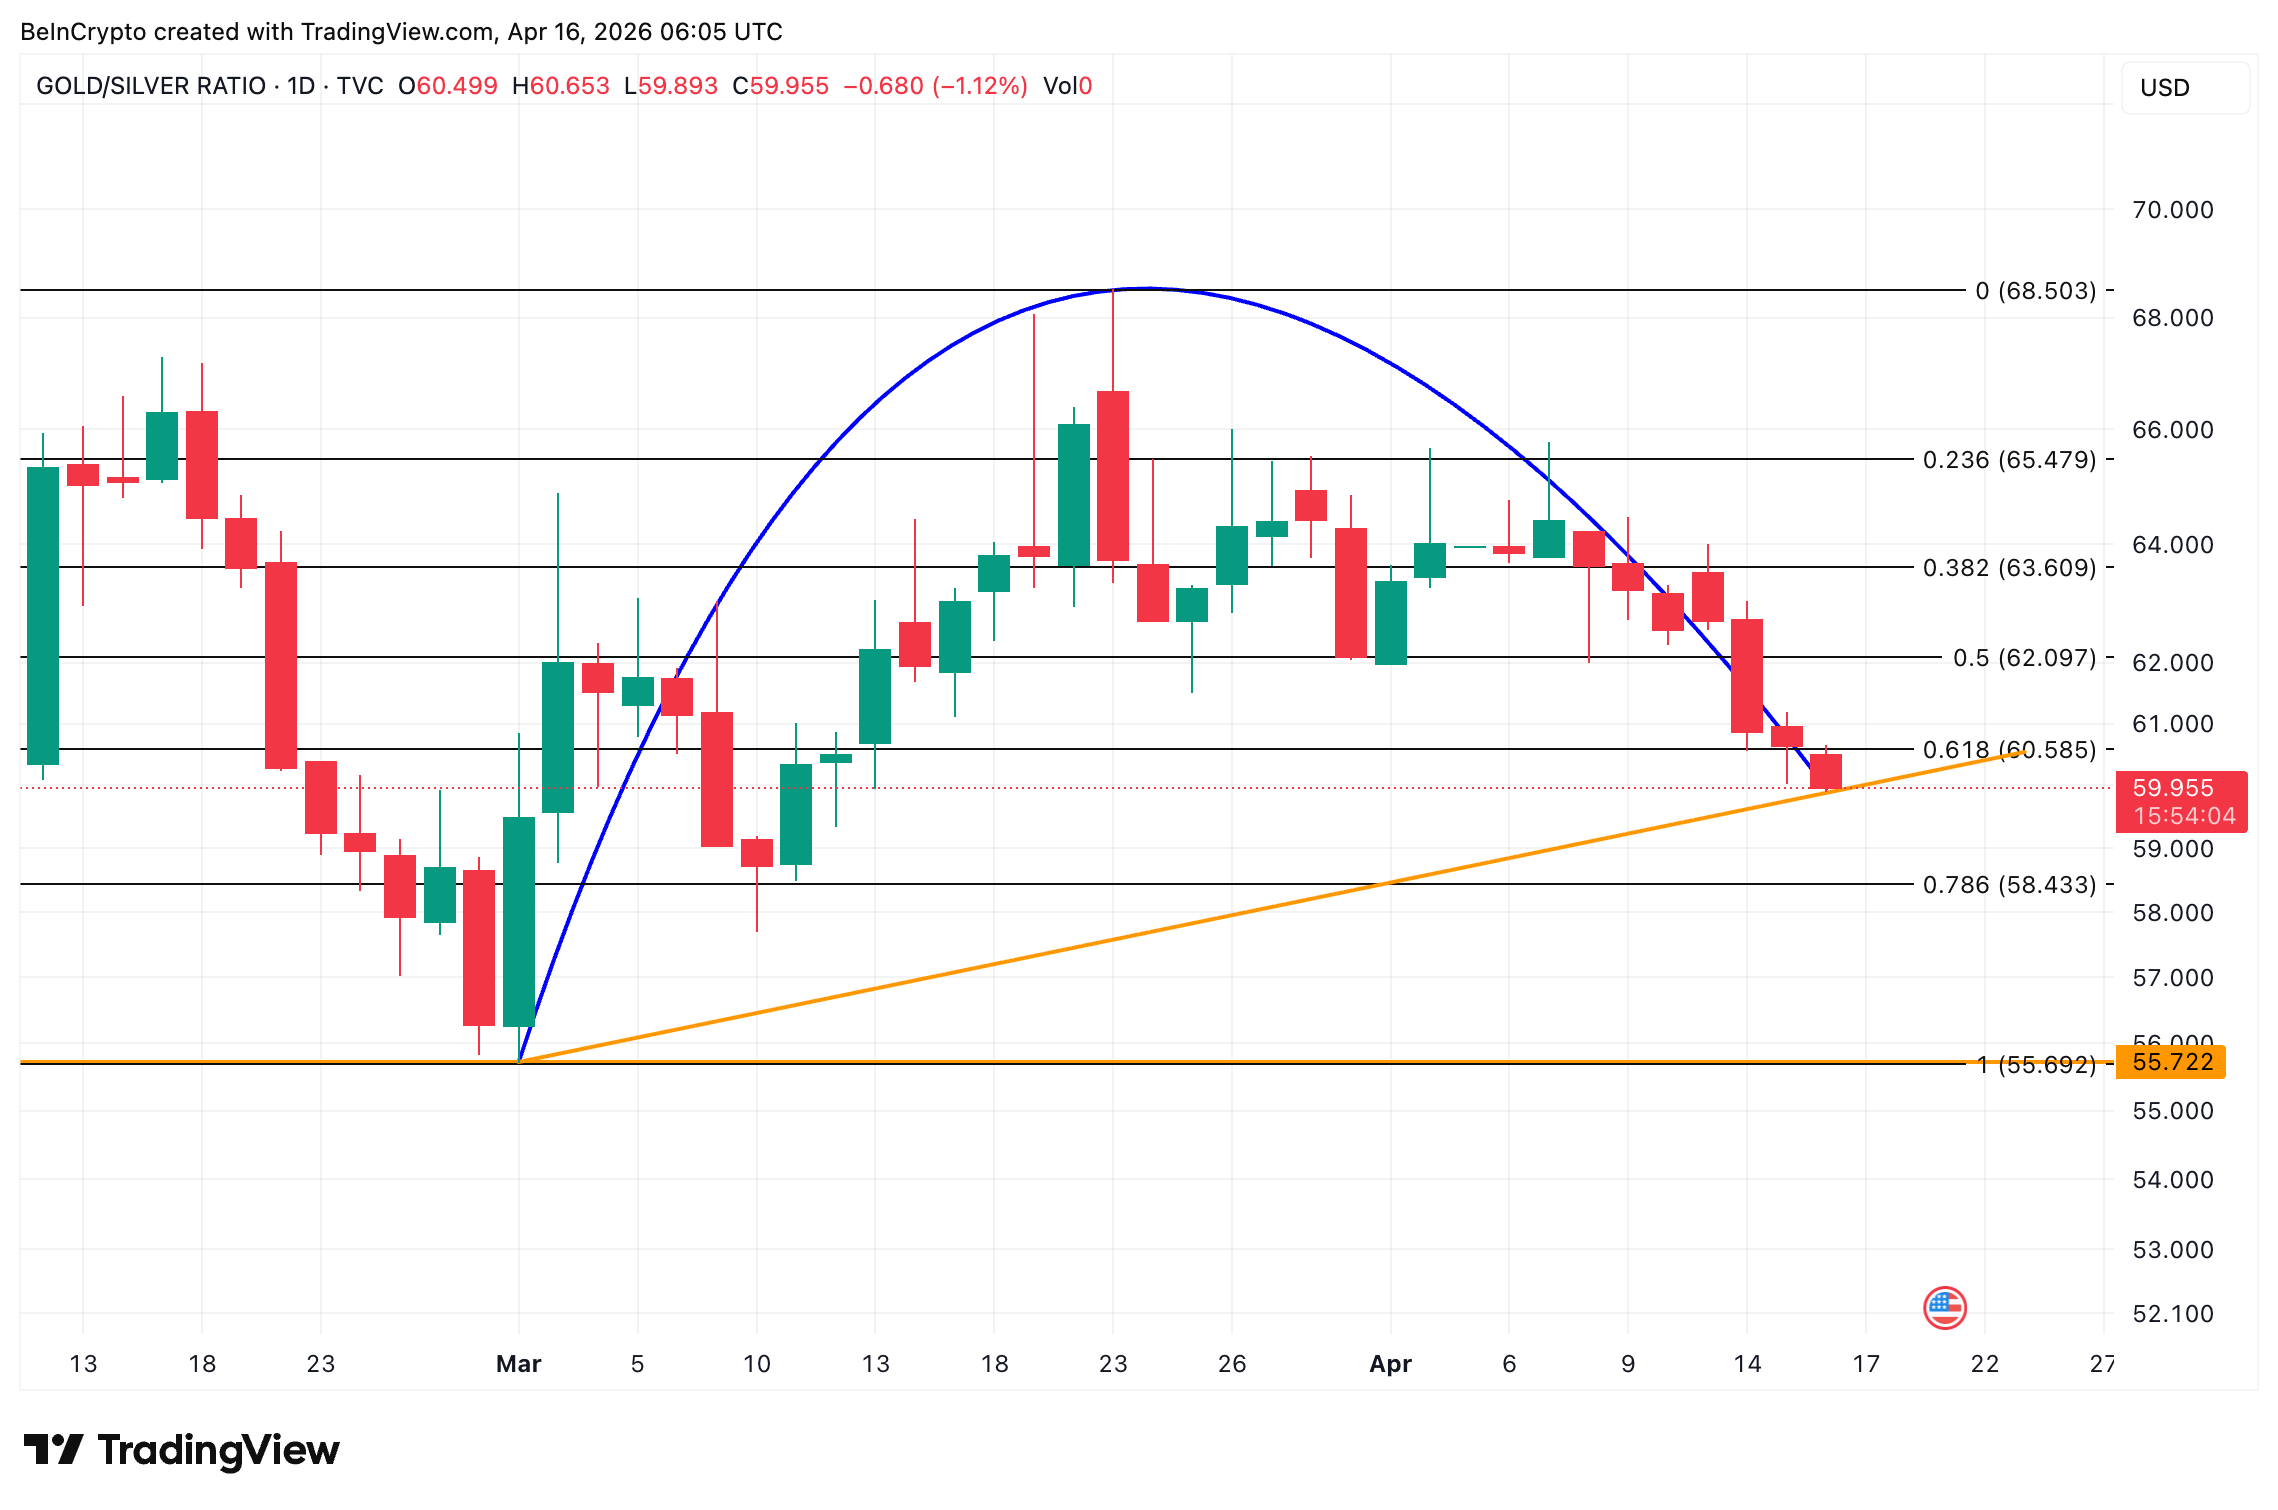
The volume divergence says the rally lacks conviction. Meanwhile, the falling gold-silver ratio says the market is choosing silver over gold. Both signals undermine the 18% recovery before it reaches the trendline.
GLD Options Traders Are Betting Against the Rally
Options data on the SPDR Gold Trust (GLD), the largest gold-backed ETF, adds the sharpest warning. On April 1, the put-call volume ratio stood at 0.32. That reading was heavily call-skewed, reflecting bullish sentiment early in the recovery.
By April 15, however, the volume ratio had climbed to 0.70. Put activity more than doubled while gold was rising. The open interest ratio held steady at 0.55. That means new bearish bets are being placed without old bullish positions being unwound.
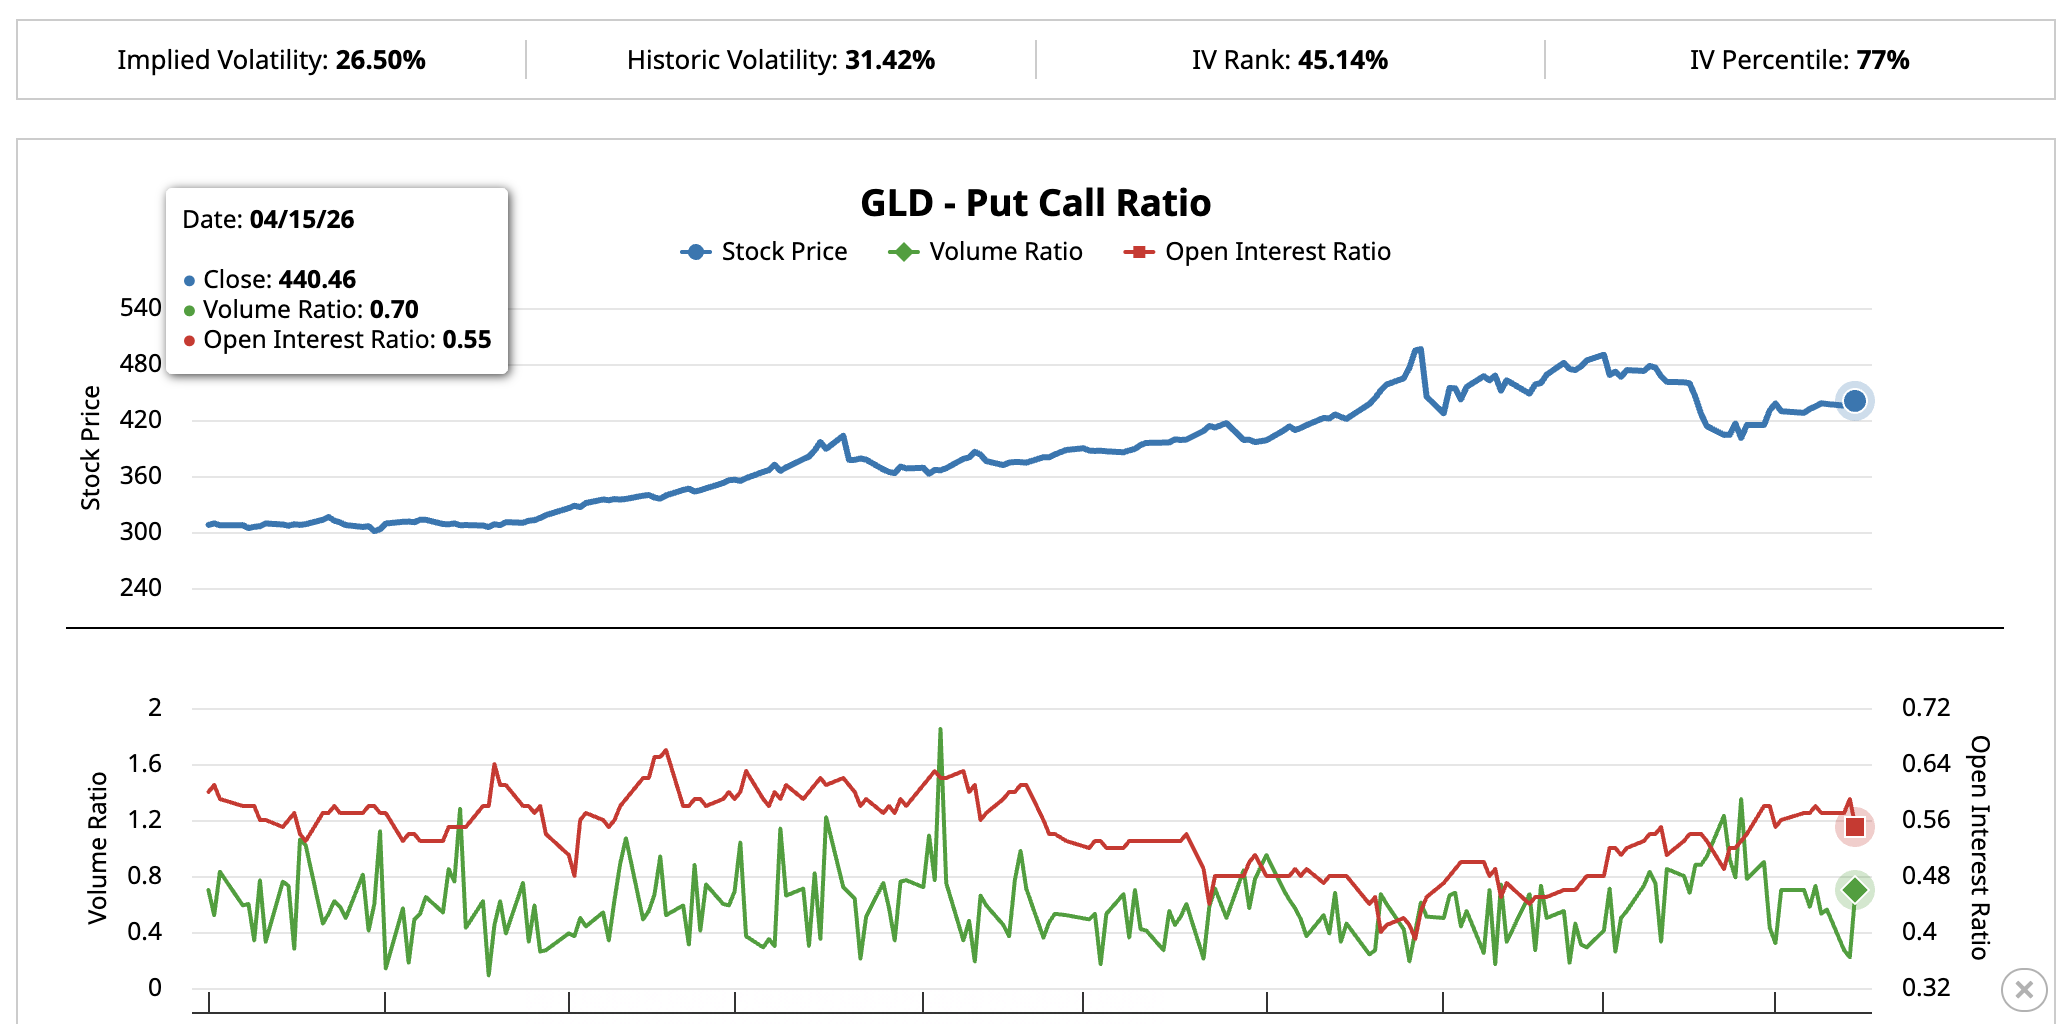
Despite the Gold price rally, options traders are positioning for a reversal. Rising put activity and steady OI all align with the signals from the previous section.
Gold Price Levels That Decide If the Rally Breaks Through or Fades
The price chart maps critical levels for XAU/USD . The metal currently sits at $4,824, trapped between $4,751 and $4,953. That range has contained price action for the past several sessions.
A move above $4,953, the 0.5 Fibonacci level, would signal short-term strength. However, the true breakout level is $5,155, the 0.618 Fibonacci. That zone aligns with the upper trendline of the falling channel. A daily close above $5,155 would mean gold has exited the bearish structure for the first time since January. Targets then open at $5,443, $5,600, and $5,810.
Yet a failure at $5,155 would validate the bearish signals. A loss of $4,751, the 0.382 Fibonacci, would break the current floor. Below that, $4,501 becomes the next support. A return to $4,097 remains possible if the channel reasserts control.
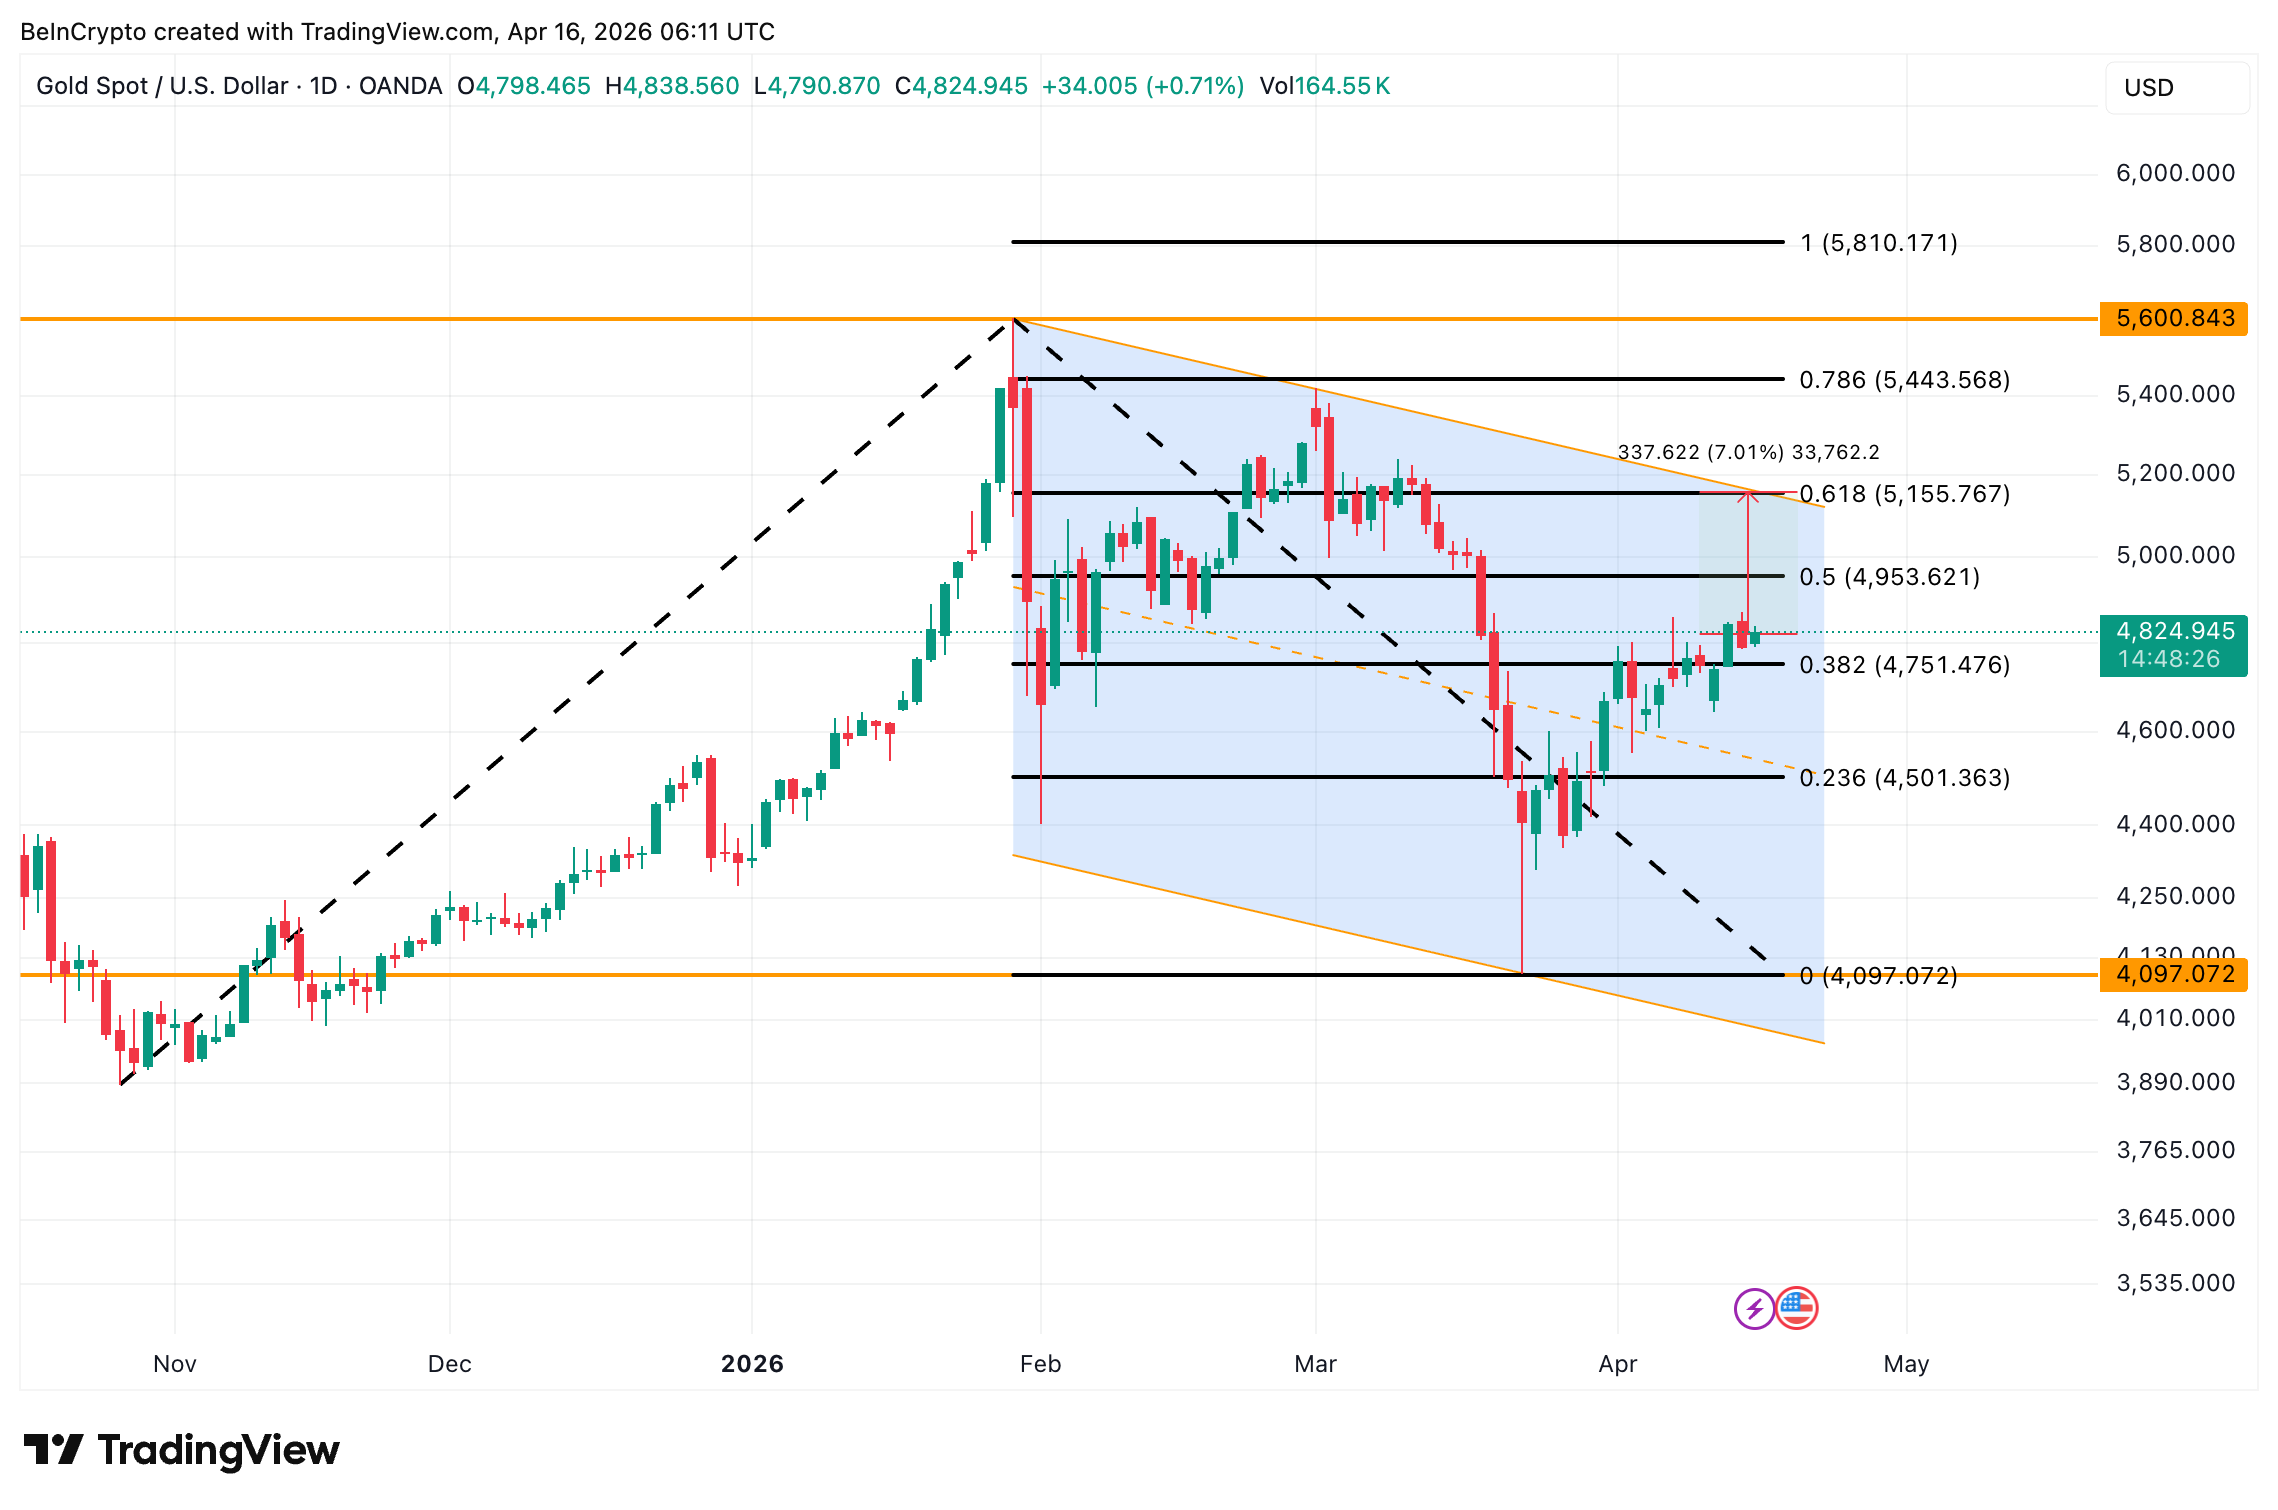
Gold price at $5,155 separates a breakout from a fade. A close above it and the 18% rally earns its conviction, which is currently missing.
 Don't Miss Today's Market Moves Start trading Forex, Gold & Indices today Regulated platform | Fast withdrawals
* The content presented above, whether from a third party or not, is considered as general advice only. This article should not be construed as containing investment advice, investment recommendations, an offer of or solicitation for any transactions in financial instruments.


