




1.3140: From a safety net to a ceiling for GBP/USD
- GBP/USD rebounds to near 1.3110 after a sharp two-day decline.
- Fed’s hawkish undertone continues to strengthen the US Dollar.
- UK Retail Sales rose 0.7% MoM in October vs. estimates of flat performance.
The British Pound (GBP) snaps the two-day decline and rebounds to near 1.3110 against the US Dollar during the European trading session on Friday. The GBP/USD pair attracts bids after hitting a fresh almost a year low at 1.3079 earlier in the day.
The Cable regains a temporary ground as the rally in the US Dollar hits a brief pause. As of writing, the US Dollar Index (DXY), which gauges the Greenback’s value against six major currencies, trades marginally lower to near 103.85 after posting a fresh 19-month high near 104.00 the previous day.
The outlook of the US Dollar appears bullish on the back of fears that the Federal Reserve (Fed) will deliver back-to-back interest rate hikes in the near term.
Dollar strength underpinned as FOMC expectations swing hawkish again
Analysts at Rabobank highlight that the repricing of the US rate path has been substantial, with the OIS curve now implying that “investors are positioned for a full hike in December, followed by close to 70% of a 25bp hike priced in for the January meeting.” They note that this configuration is “in line with Waller’s comments, after having moved from one of the most hawkish to one of the most dovish FOMC members and now back among the most hawkish.” According to Rabobank, his recent calls are for “either a 50bp hike at the December meeting or a 25bp hike accompanied by clear forward guidance from Warsh that an additional hike will follow in January.” Against this backdrop, the bank observes that “the USD has continued to dominate FX markets, with the DXY Index climbing back to levels not seen since 2025 on the back of elevated US hiking expectations and safe-haven demand.”
On the British Pound front, the United Kingdom (UK) Retail Sales data for October has come in stronger than expected. The Office for National Statistics (ONS) reported that Retail Sales grew 0.7% Month-on-Month (MoM), while the growth was expected to remain flat.
GBP/USD Technical Analysis
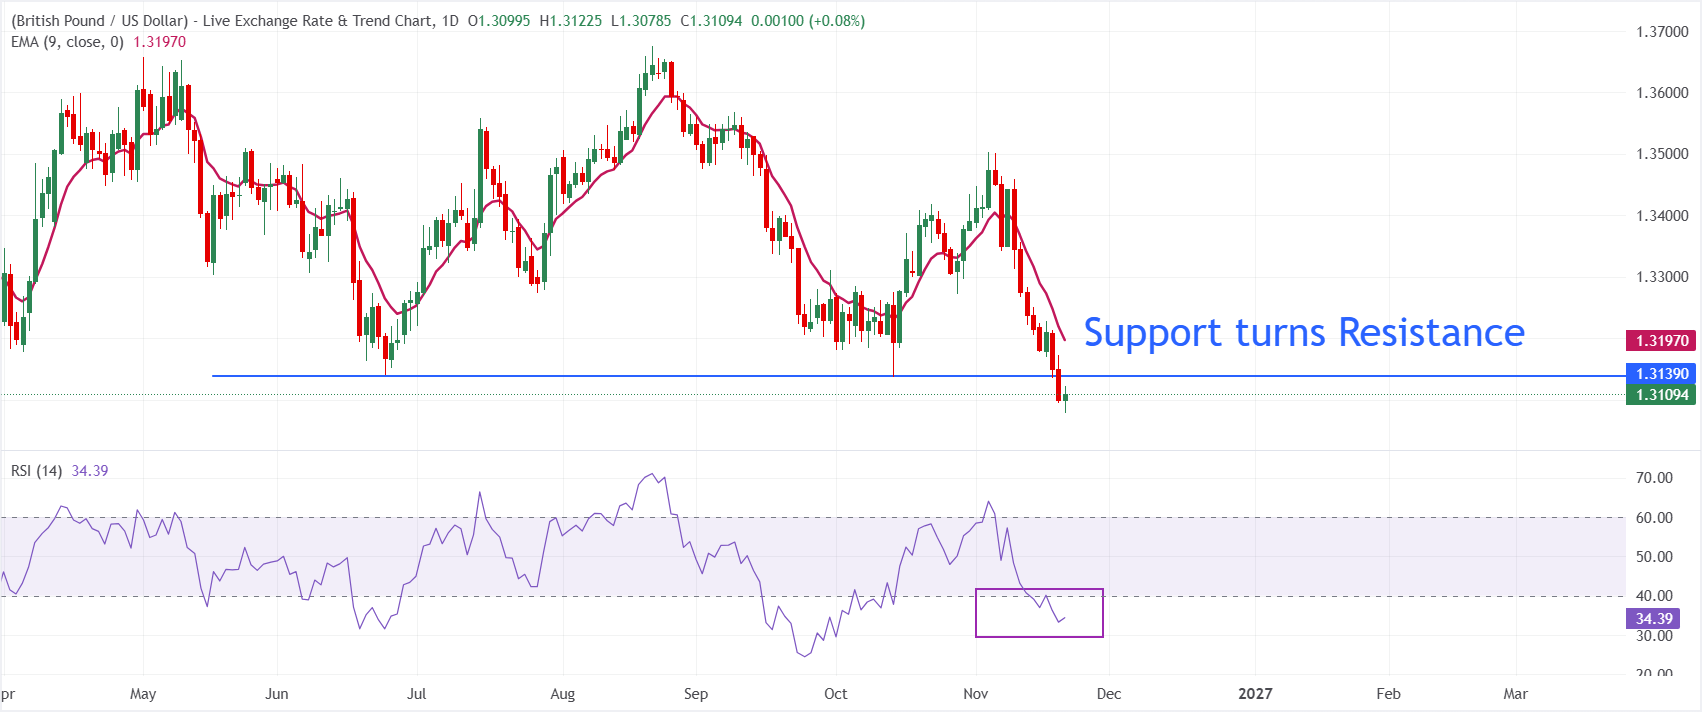
In the daily chart, GBP/USD trades at 1.3109, extending a bearish near-term bias as spot holds beneath the 9-period Exponential Moving Average (EMA) at 1.3197. The pair remains pressured while this short-term EMA caps rebounds, although the Relative Strength Index (RSI) around 34 suggests downside momentum is losing some intensity rather than accelerating into oversold territory.
The breakdown of the June 24 low at 1.3140 has also boosted fears of a fresh downside leg, which will act as key hurdle for the pair going forward. Looking down, the pair could extend its decline towards 1.3000.
(The technical analysis of this story was written with the help of an AI tool. Know more.)
Economic Indicator
Retail Sales (MoM)
The Retail Sales data, released by the Office for National Statistics on a monthly basis, measures the volume of sales of goods by retailers in Great Britain directly to end customers. Changes in Retail Sales are widely followed as an indicator of consumer spending. Percent changes reflect the rate of changes in such sales, with the MoM reading comparing sales volumes in the reference month with the previous month. Generally, a high reading is seen as bullish for the Pound Sterling (GBP), while a low reading is seen as bearish.
Read more.Last release: Fri Nov 20, 2026 07:00
Frequency: Monthly
Actual: 0.7%
Consensus: 0%
Previous: -0.4%
Source: Office for National Statistics
Recommended Articles


