




EUR/USD Price Forecast: Strong US CPI keeps bears in control despite oversold RSI
- The Euro hits a fresh low since May 2025 as stronger US inflation lifts the Greenback.
- EUR/USD trades below its 50-, 100- and 200-day SMAs, keeping the broader technical picture bearish.
- The ADX near 53 points to strong selling pressure, while the RSI signals oversold conditions.
EUR/USD loses nearly 0.50% on Wednesday as stronger-than-expected US inflation data reinforce expectations of further Federal Reserve (Fed) rate hikes, lifting the US Dollar (USD) to fresh year-to-date highs above 102.50. At the time of writing, the pair trades around 1.1145 after touching an intraday low of 1.1113, its lowest level since May 2025.
According to the CME FedWatch Tool, traders now price in a 43% chance of a rate hike at the Fed’s October 27-28 meeting, up from 22% before the release, while the probability of a December rate hike stands near 95%.
TD Securities argues that "today's report makes the Fed's calculus for October more complicated following recent clear guidance about skipping a hike at the next meeting." They now estimate a "solid 0.36% m/m gain for core PCE," and highlight that "Fed leadership appears to have decided to execute a gradual tightening cycle on the back of market pricing, through with the notable broad-based rise in yields partly doing some of the tightening for them."
Expectations of further Fed tightening keep EUR/USD vulnerable to more losses, with France’s fiscal and political troubles adding to the Euro’s (EUR) headwinds.
Technical analysis
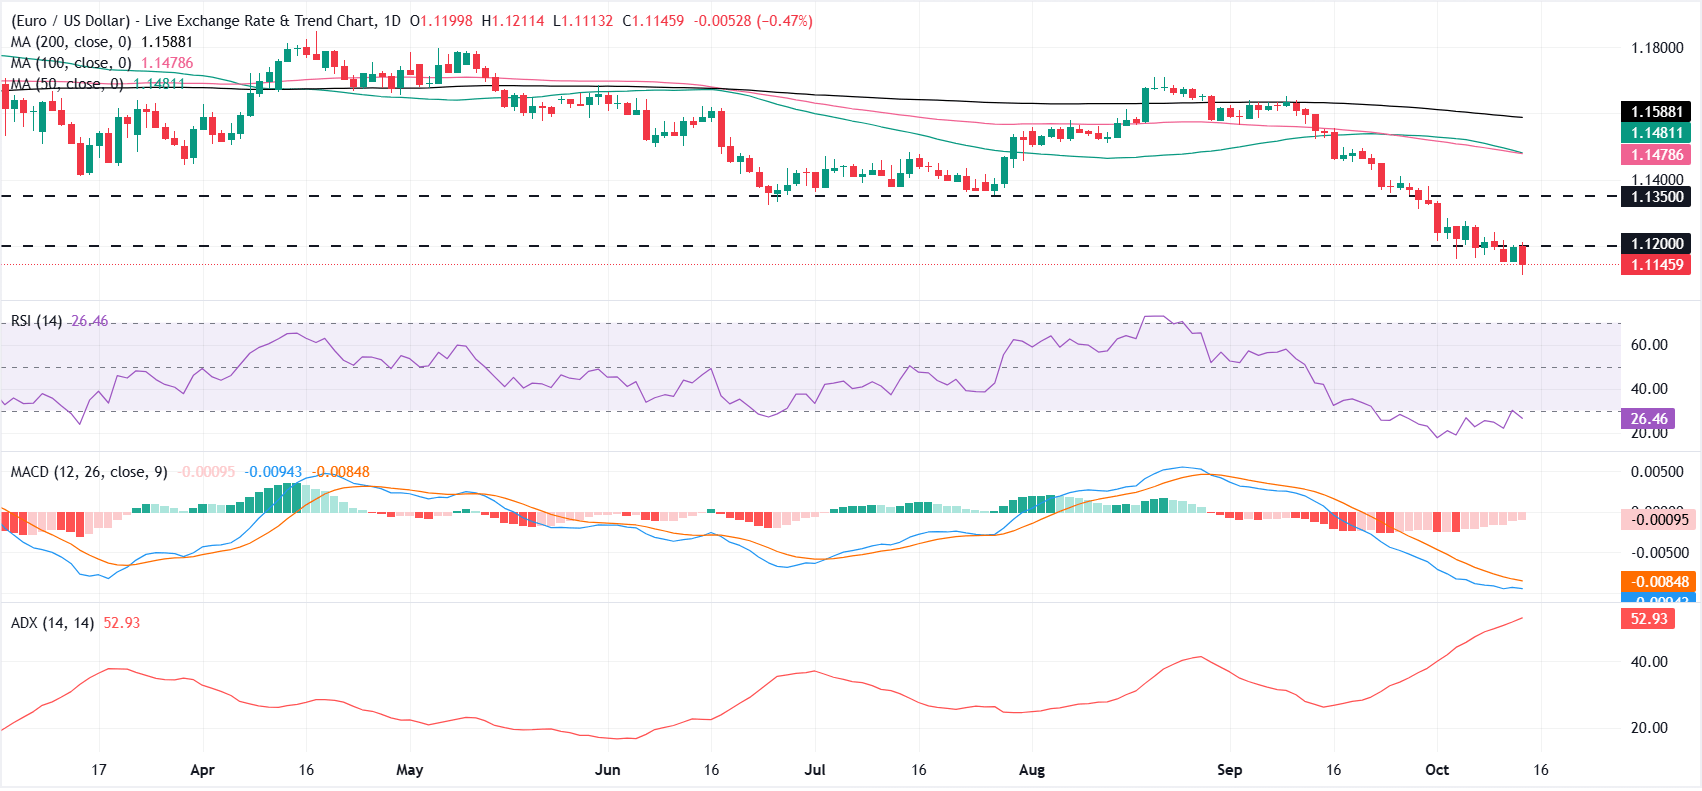
From a technical standpoint, EUR/USD has faced sustained selling pressure since mid-August, after buyers failed to break above 1.1700. The pair has since reversed sharply, falling below its key Simple Moving Averages (SMAs). The 50-day SMA at 1.1481, the 100-day SMA at 1.1479 and the 200-day SMA at 1.1588 all sit well above spot, suggesting the pair remains entrenched in a broader downtrend.
Momentum conditions reinforce this tone, with the RSI on the daily chart hovering in oversold territory near 26 and the Moving Average Convergence Divergence (MACD) indicator holding below zero with a negative line, while the rising Average Directional Index around 53 hints at a strong, persistent bearish trend.
On the topside, immediate resistance lies at the 1.1200 psychological mark, followed by 1.1350. Beyond this, the 100-day SMA at 1.1483 and the 50-day SMA at 1.1489 form a firm resistance zone. The 200-day SMA at 1.1591 presents a further hurdle ahead of 1.1700.
On the downside, initial support stands at 1.1150. A break below this level could open the door to the 1.1000 psychological mark.
(The technical analysis of this story was written with the help of an AI tool. Know more.)
Euro Price This Month
The table below shows the percentage change of Euro (EUR) against listed major currencies this month. Euro was the weakest against the Australian Dollar.
| USD | EUR | GBP | JPY | CAD | AUD | NZD | CHF | |
|---|---|---|---|---|---|---|---|---|
| USD | 1.63% | 0.68% | 0.57% | 0.12% | -0.25% | 0.82% | -0.09% | |
| EUR | -1.63% | -0.95% | -1.02% | -1.46% | -1.87% | -0.80% | -1.67% | |
| GBP | -0.68% | 0.95% | -0.10% | -0.53% | -0.96% | 0.15% | -0.65% | |
| JPY | -0.57% | 1.02% | 0.10% | -0.48% | -0.86% | 0.31% | -0.61% | |
| CAD | -0.12% | 1.46% | 0.53% | 0.48% | -0.38% | 0.77% | -0.19% | |
| AUD | 0.25% | 1.87% | 0.96% | 0.86% | 0.38% | 1.09% | 0.24% | |
| NZD | -0.82% | 0.80% | -0.15% | -0.31% | -0.77% | -1.09% | -0.91% | |
| CHF | 0.09% | 1.67% | 0.65% | 0.61% | 0.19% | -0.24% | 0.91% |
The heat map shows percentage changes of major currencies against each other. The base currency is picked from the left column, while the quote currency is picked from the top row. For example, if you pick the Euro from the left column and move along the horizontal line to the US Dollar, the percentage change displayed in the box will represent EUR (base)/USD (quote).
Recommended Articles


