




EUR/USD Price Forecast: Bears target a break below 1.1350 support
- EUR/USD nears three-week lows as the US Dollar strengthens.
- The pair trades below the 21-day, 50-day and 100-day SMAs, keeping sellers in control.
- Immediate resistance is seen at 1.1415, while 1.1350 remains key support.
EUR/USD trades on the back foot on Thursday as the expanding war in the Middle East pushes Oil prices higher and fuels hawkish Federal Reserve (Fed) expectations, boosting demand for the US Dollar (USD). Meanwhile, the European Central Bank’s (ECB) decision to leave interest rates unchanged draws little market reaction.
At the time of writing, the pair trades around 1.1379, near three-week lows. The US Dollar Index (DXY), which tracks the Greenback’s value against a basket of six major currencies, trades around 101.40, recovering from an intraday low of 100.94.
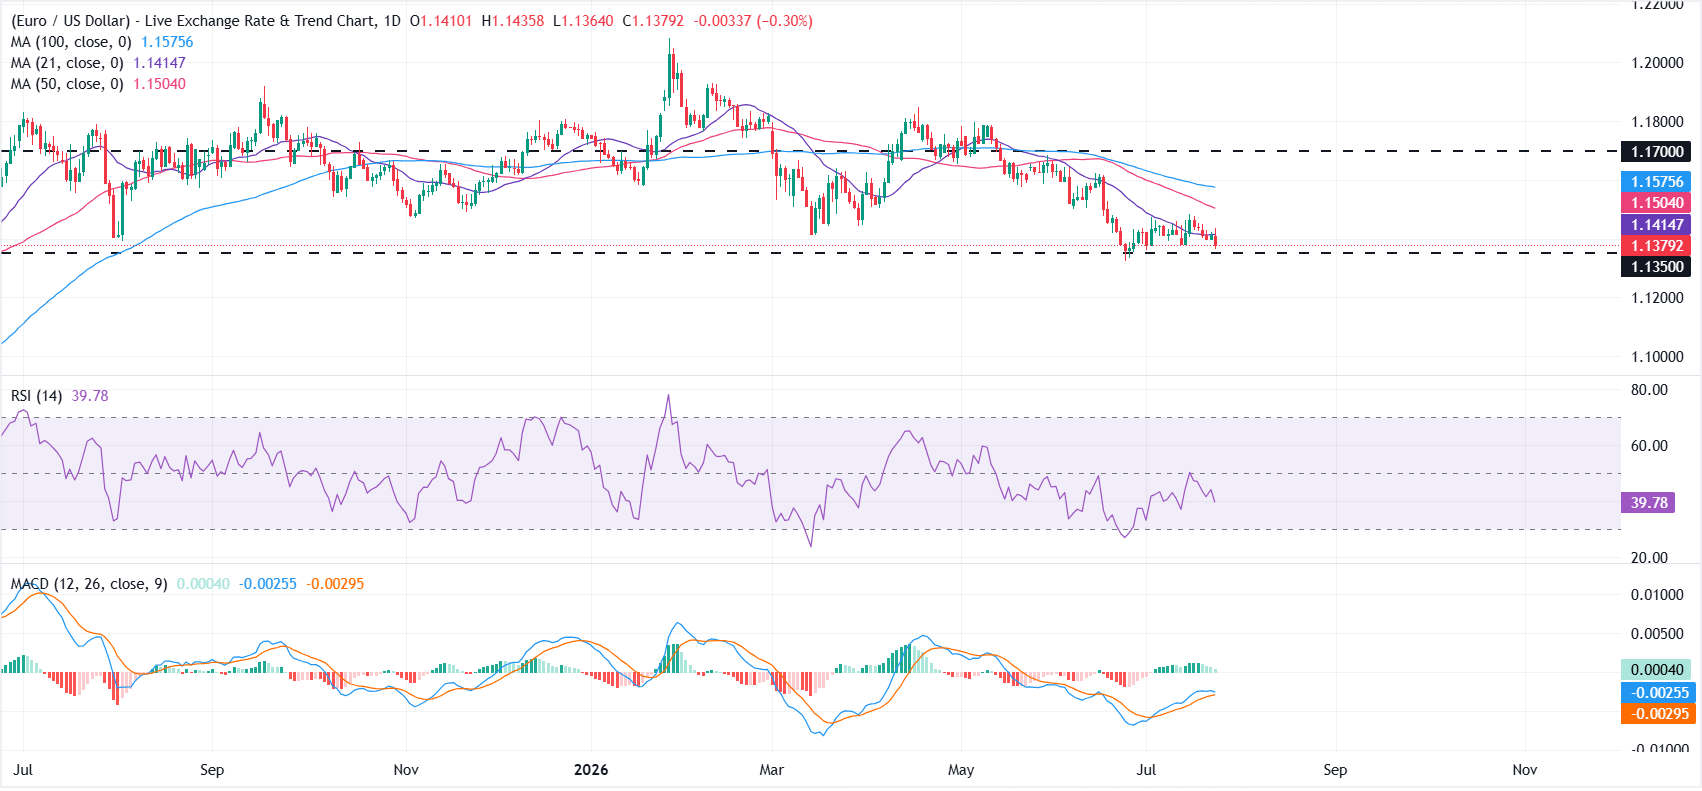
From a technical perspective, EUR/USD has formed a base above 1.1350, although downside risks are building. On the daily chart, the pair retains a bearish near-term bias while trading below the 21-day Simple Moving Average (SMA) at 1.1415 and the 50-day SMA at 1.1504, with the 100-day SMA at 1.1576 reinforcing the broader bearish structure.
The Relative Strength Index (RSI) at 39 remains below the neutral 50 mark, highlighting persistent bearish momentum. Meanwhile, the Moving Average Convergence Divergence (MACD) indicator is marginally positive, suggesting that buying momentum remains tentative despite signs of stabilization.
On the upside, initial resistance is seen at the 21-day SMA near 1.1415, followed by the 50-day SMA at 1.1504 and the 100-day SMA at 1.1576, ahead of the key horizontal resistance at 1.1700.
On the downside, immediate support lies at 1.1350. A sustained break below this level could expose the pair to deeper losses, while holding above it would reinforce the newly established base and keep the door open for a corrective rebound toward the nearby moving averages.
(The technical analysis of this story was written with the help of an AI tool. Know more.)
US Dollar Price Today
The table below shows the percentage change of US Dollar (USD) against listed major currencies today. US Dollar was the strongest against the New Zealand Dollar.
| USD | EUR | GBP | JPY | CAD | AUD | NZD | CHF | |
|---|---|---|---|---|---|---|---|---|
| USD | 0.29% | 0.39% | 0.36% | -0.08% | 0.30% | 0.68% | 0.24% | |
| EUR | -0.29% | 0.10% | 0.09% | -0.39% | 0.00% | 0.41% | -0.06% | |
| GBP | -0.39% | -0.10% | -0.02% | -0.50% | -0.10% | 0.27% | -0.15% | |
| JPY | -0.36% | -0.09% | 0.02% | -0.44% | -0.07% | 0.32% | -0.13% | |
| CAD | 0.08% | 0.39% | 0.50% | 0.44% | 0.37% | 0.77% | 0.31% | |
| AUD | -0.30% | -0.00% | 0.10% | 0.07% | -0.37% | 0.41% | -0.04% | |
| NZD | -0.68% | -0.41% | -0.27% | -0.32% | -0.77% | -0.41% | -0.47% | |
| CHF | -0.24% | 0.06% | 0.15% | 0.13% | -0.31% | 0.04% | 0.47% |
The heat map shows percentage changes of major currencies against each other. The base currency is picked from the left column, while the quote currency is picked from the top row. For example, if you pick the US Dollar from the left column and move along the horizontal line to the Japanese Yen, the percentage change displayed in the box will represent USD (base)/JPY (quote).
Recommended Articles


