




USD/CHF Price Forecast: Buyers hold the upper hand above 0.8000
- USD/CHF edges higher as Middle East tensions support the US Dollar.
- Holding above 0.8000 keeps the near-term bias tilted to the upside.
- RSI points to positive momentum, while a softer ADX suggests the trend is losing strength.
USD/CHF edges higher as escalating tensions in the Middle East support the US Dollar (USD), with buyers eyeing a breakout above the 0.8150 resistance level that has capped gains since July 2025. At the time of writing, the pair trades around 0.8123, up 0.27% on the day.
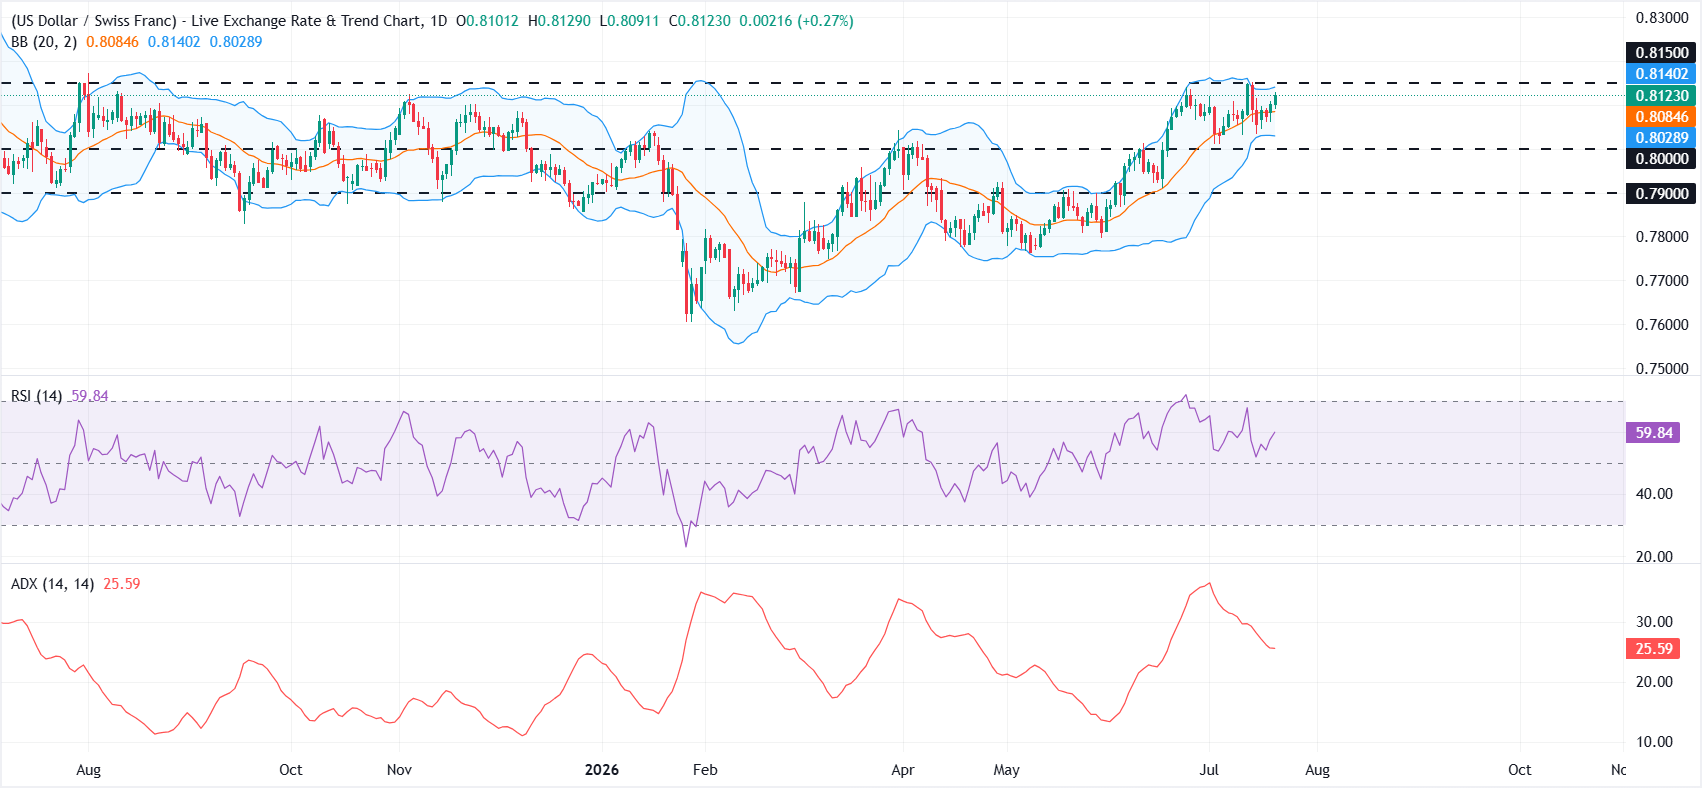
From a technical perspective, USD/CHF has largely traded sideways after breaking above 0.8000 in June. A successful retest of that level drew buyers back into the market. Holding above 0.8000 keeps the near-term bias tilted to the upside, although buyers may need a fresh catalyst to clear 0.8150.
On the daily chart, the pair trades above the Bollinger Bands 20-period Simple Moving Average (SMA) at 0.8084 and is approaching the upper band at 0.8140.
The Relative Strength Index (RSI) near 59 points to positive momentum without signalling overbought conditions. However, the Average Directional Index (ADX) has eased to around 26 from above 30, suggesting the recent advance is losing some strength.
Immediate resistance lies at the upper Bollinger Band near 0.8140, closely followed by the multi-month barrier at 0.8150. On the downside, initial support sits at the Bollinger midline at 0.8084, followed by the lower band at 0.8029. Below that, the 0.8000 and 0.7900 horizontal levels could attract buying interest.
(The technical analysis of this story was written with the help of an AI tool. Know more.)
Swiss Franc Price Today
The table below shows the percentage change of Swiss Franc (CHF) against listed major currencies today. Swiss Franc was the strongest against the British Pound.
| USD | EUR | GBP | JPY | CAD | AUD | NZD | CHF | |
|---|---|---|---|---|---|---|---|---|
| USD | 0.05% | 0.43% | 0.31% | 0.22% | -0.14% | 0.12% | 0.25% | |
| EUR | -0.05% | 0.39% | 0.26% | 0.18% | -0.16% | 0.08% | 0.20% | |
| GBP | -0.43% | -0.39% | -0.11% | -0.21% | -0.55% | -0.31% | -0.18% | |
| JPY | -0.31% | -0.26% | 0.11% | -0.09% | -0.44% | -0.21% | -0.06% | |
| CAD | -0.22% | -0.18% | 0.21% | 0.09% | -0.35% | -0.10% | 0.03% | |
| AUD | 0.14% | 0.16% | 0.55% | 0.44% | 0.35% | 0.25% | 0.40% | |
| NZD | -0.12% | -0.08% | 0.31% | 0.21% | 0.10% | -0.25% | 0.13% | |
| CHF | -0.25% | -0.20% | 0.18% | 0.06% | -0.03% | -0.40% | -0.13% |
The heat map shows percentage changes of major currencies against each other. The base currency is picked from the left column, while the quote currency is picked from the top row. For example, if you pick the Swiss Franc from the left column and move along the horizontal line to the US Dollar, the percentage change displayed in the box will represent CHF (base)/USD (quote).
Recommended Articles


