




XRP (XRPUSD) Is down 1.22% on Oct 26: What Do On-Chain Data and Market Sentiment Show?
XRP (XRPUSD) is down 1.22% at Oct 26 21:45(ET), now at $1.2844, with a 7-day down of 1.28%.
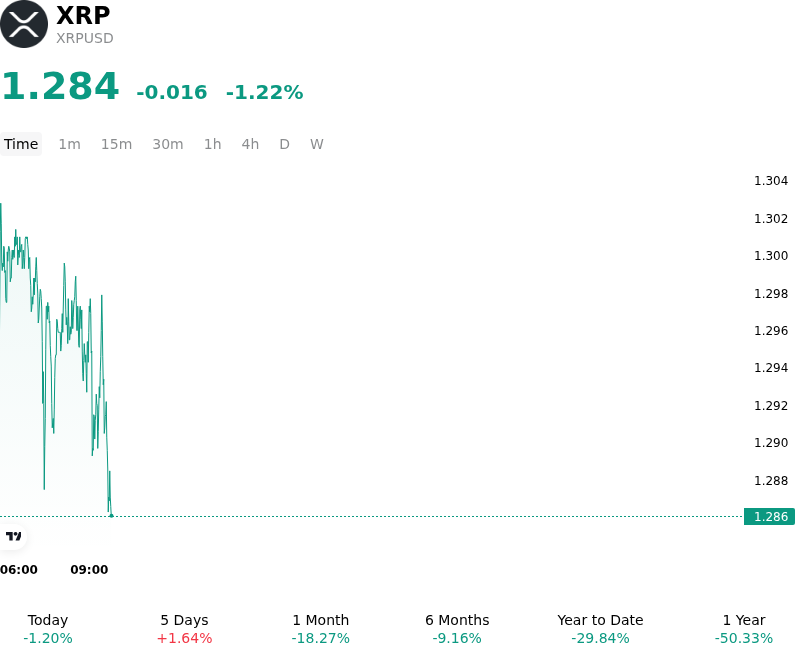
What is driving XRP (XRPUSD)’s stock price down today?
Institutional risk aversion and macro liquidity tightening weighed on XRP as digital asset markets adjusted positions ahead of the upcoming Federal Reserve monetary policy meeting. Broad-based caution across risk assets led institutional investors to reduce exposure to high-beta altcoins, favoring capital preservation over speculative positioning. The broader macroeconomic backdrop, characterized by elevated Treasury yields and persistent policy uncertainty, created headwinds for cross-border payment tokens and limited fresh capital inflows into altcoin markets.
At the asset-specific level, market participants reflected caution despite upcoming ecosystem milestones, including Ripple's annual Swell conference. Historical price action around key corporate gatherings often exhibits buy-the-rumor, sell-the-news dynamics or pre-event profit taking. While corporate tokenization initiatives and institutional custody partnerships continue to expand across global financial hubs, investors remain focused on whether enterprise integrations translate into direct spot token velocity and sustained market demand rather than long-term strategic positioning alone. Additionally, capital flows into spot XRP exchange-traded products moderated after an extended period of inflows, signaling temporary fatigue among institutional allocators.
Derivatives market dynamics further compounded downward pressure during the session. Leverage positioning showed signs of long liquidation as price action tested technical support levels, triggering localized order book imbalances. Capped beneath key overhead moving average clusters, spot liquidity thinned, leaving order books vulnerable to modest institutional distribution and short-term hedging activity. The compression in futures open interest indicates that speculative traders preferred to step aside rather than absorb selling flow prior to macro clarity.
Going forward, institutional investors continue to monitor broader global liquidity trends, Federal Reserve interest rate guidance, spot ETF flow continuity, and sustained on-chain activity. Until macroeconomic certainty improves and spot order book depth recovers, XRP remains sensitive to shifts in overarching risk sentiment and derivatives positioning.
Technical Analysis of XRP (XRPUSD)
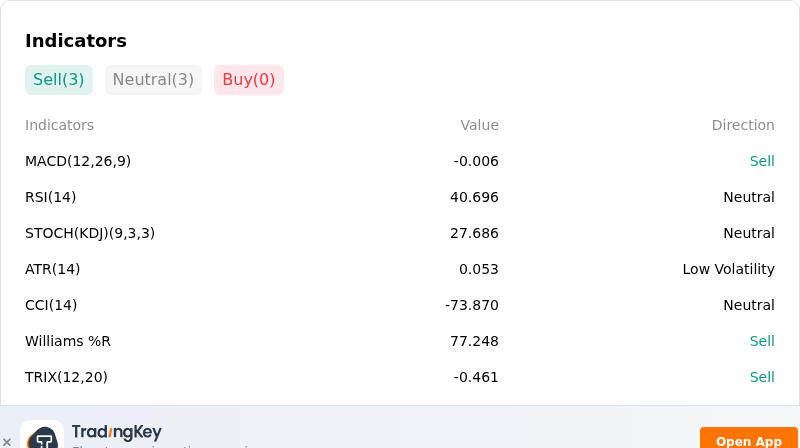
Technically, XRP (XRPUSD) shows a MACD (12,26,9) value of -0.006, indicating a sell signal. The RSI at 40.696 suggests neutral condition and the Williams %R at 77.248 suggests sell condition. Please monitor closely.
More details about XRP (XRPUSD)
Recent Events and Risks:
- Derivatives Long Liquidation Cascade: Forced liquidations of leveraged long positions exceeded $7.55 million over recent trading sessions, generating a severe 2,008% long-to-short liquidation imbalance as XRP dropped toward $1.27 and triggered automated sell orders across major exchanges.
- Escalating Exchange Reserves and Whale Distribution: On-chain metrics show centralized exchange balances climbing toward a yearly high near 11.81 billion XRP, driven by heavy whale deposits to trading venues that create immediate spot supply overhead and limit upside price recovery.
- Stagnant Institutional ETF Flows: Capital allocation into spot XRP ETFs has weakened sharply, transitioning to minimal single-day inflows under $1 million and net weekly outflows, reducing institutional liquidity available to absorb ongoing spot market selling.
- Technical Pattern Breakdown and Key Support Vulnerability: The price action completed a technical double-top breakdown below key moving averages, exposing XRP to accelerated sell-off risks toward crucial support floors at $1.25 and $1.00.
Recommended Articles


