




Solana (SOLUSD) Fluctuated Significantly on Oct 17: Key Variables Behind the Move
Solana (SOLUSD) is down 1.51% at Oct 17 20:45(ET), now at $103.08, with a 7-day down of 5.73%.
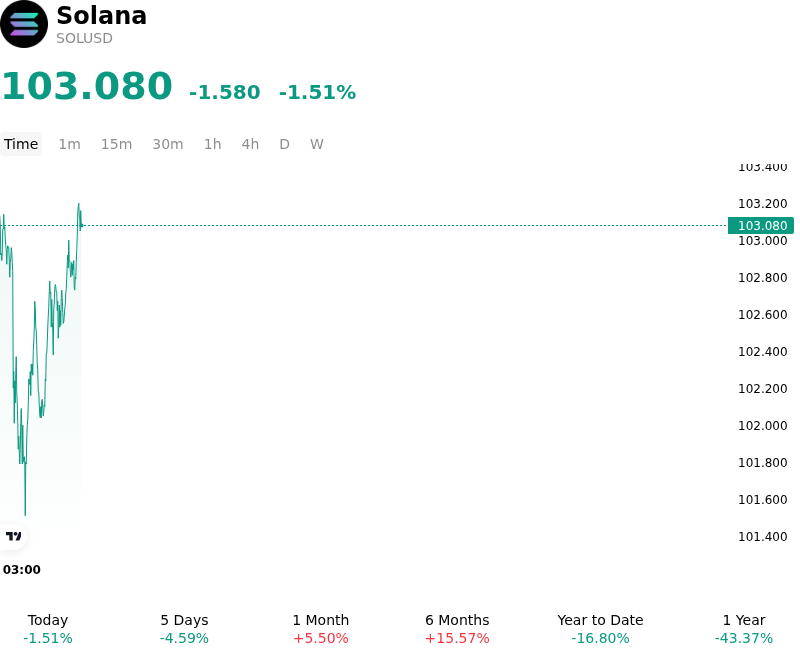
What is driving Solana (SOLUSD)’s stock price down today?
The pullback in Solana reflects a combination of broader macroeconomic headwinds, tightening global liquidity, and institutional risk reduction across high-beta digital assets. Elevated U.S. Treasury yields and a resilient U.S. dollar have tightened financial conditions, suppressing overall risk sentiment across the digital asset space. In this environment of elevated macroeconomic uncertainty, market participants have prioritized capital preservation, scaling back exposure to higher-beta Layer-1 tokens and dampening buy-side momentum.
Institutional demand for Solana has also experienced temporary friction, highlighted by persistent net outflows from Solana-linked investment products and spot ETFs. Institutional asset managers have adopted a defensive posture, choosing to restrain fresh capital allocation while assessing Federal Reserve policy trajectories and operational execution risk around network infrastructure upgrades. The temporary withdrawal of consistent institutional buy flows has reduced spot market liquidity depth, leaving the asset vulnerable to market-wide risk-off shifts.
Derivatives positioning further amplified intraday downward pressure. As price action slipped past near-term technical support levels, automated long liquidations were triggered across major perpetual futures exchanges. This liquidation cascade forced rapid long position unwinds, contracting aggregate open interest and resetting funding rates toward neutral levels. The leverage flush indicates that the decline was primarily driven by speculative positioning adjustments rather than structural spot distribution.
Despite near-term price headwinds, Solana's core network metrics remain resilient, supported by healthy stablecoin liquidity and steady decentralized application activity. However, near-term price discovery continues to be governed by broader digital asset risk appetite, institutional flow trends, and global monetary policy expectations. Investors maintain a watchful eye on macro liquidity signals and derivatives positioning for signs of price stabilization.
Technical Analysis of Solana (SOLUSD)
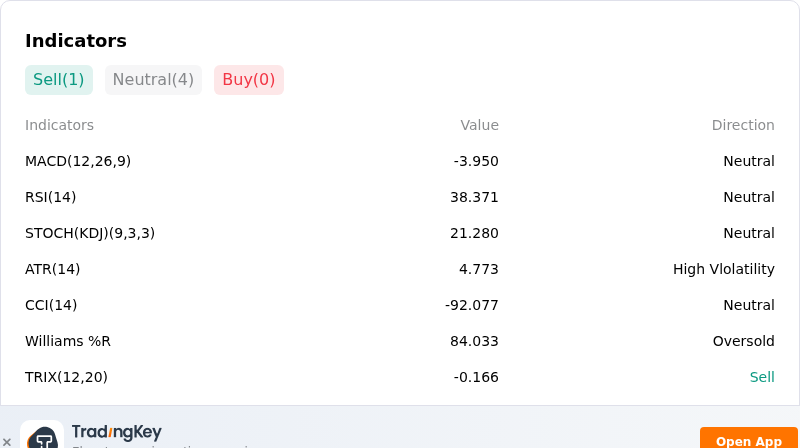
Technically, Solana (SOLUSD) shows a MACD (12,26,9) value of -3.950, indicating a neutral signal. The RSI at 38.371 suggests neutral condition and the Williams %R at 84.033 suggests oversold condition. Please monitor closely.
More details about Solana (SOLUSD)
Recent Events and Risks:
- Institutional Capital Flight and Continuous Spot ETF Outflows: U.S. spot Solana ETFs recorded their largest net weekly outflow on record at $24.8 million—snapping a 14-week streak of consecutive inflows—followed by extended daily redemptions that highlight shrinking institutional risk appetite and persistent altcoin exposure trimming.
- Inverted Derivatives Volatility and Immediate Protection Demand: Front-expiry options implied volatility on SOL surged near 66%, exceeding longer-dated 30-day implied volatility. This inverted volatility curve signals acute market trader anxiety and heightened demand for short-dated put protection against near-term price drops.
- Regulatory Obstacles and Asian Regional Event Postponements: The Solana Foundation was forced to postpone its Shanghai Accelerate conference due to strict local authority registration limits and compliance friction in mainland China, underscoring persistent regulatory headwinds and operational hurdles in expanding key regional developer initiatives.
- Technical Support Degradation and Leverage Liquidation Pressure: SOL remains pinned under its 20-day and 50-day exponential moving averages while testing the critical $100 support floor. Negative funding rates and cooling futures volume indicate growing downside bias and heightened vulnerability to cascading long liquidations if key structural levels fail.
Recommended Articles


